Let’s dive into the world of mobile apps and their numbers! In this easy-to-understand introduction, Let’s explore fascinating statistics about the apps on our smartphones.
Did you know that the projected revenue for mobile apps in 2023 is estimated to be $935 billion? Thats Huge!
From how many apps are out there to how much time we spend on them, get ready for a simple yet insightful journey into mobile app statistics.
| Statistic Category | Statistic |
|---|---|
| Projected Mobile App Revenue (2023) | $935 billion |
| Number of Apps on Apple App Store | 1.96 million |
| Number of Apps on Google Play Store | 2.87 million |
| Millennial App Access Frequency | 50 times or more daily: 21% of millennials |
| Daily App Access Frequency (General) | 11 times or more: 49% of people |
| Share of Mobile Time in Digital Media (US) | 70% |
| Average Number of Apps Downloaded (Smartphone Users) | 10 apps daily, 30 apps monthly |
| Global App Downloads (Last Year) | Over 218 billion (7% increase over the previous year) |
| Free vs Paid App Downloads (Worldwide) | Free apps: 98% of all app revenue |
| Google Play Store vs Apple App Store Downloads | Google Play Store: Higher downloads & growth rate compared to Apple App Store |
| Popular App Categories on the Apple App Store | Games sector dominates |
| Popular App Categories on Google Play Store (Android) | Tools, Communication, Business, Video Players & Editors, Travel & Local, Social, Productivity |
| Average Daily Mobile App Usage | 3 hours and 10 minutes (90% on apps) |
| Average Number of Apps Used | 9 apps daily, 30 apps monthly |
| App Retention and Churn | 71% of users abandon an app within the first 90 days |
| Global Spending on Apple and Android | Apple App Store: $21.5 billion, Google Play: $12.1 billion |
| App Use by Age Group | Varies, e.g., 45-54 age group: ~1 hr 33 mins daily on apps |
Crucial Mobile App Statistics 2024
- By 2023, income from mobile apps is estimated to reach $935 billion.
- There are 1.96 million applications available for download on the Apple App Store.
- The Google Play Store has 2.87 million applications available for download.
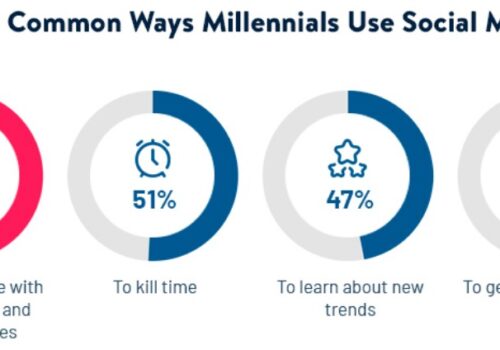
- Millennials access an app 50 times or more every day, according to 21% of them.
- Every day, 49% of individuals access an app 11 times or more.
- Mobile apps account for 70% of all digital media time in the United States.
- The average smartphone user downloads Ten applications per day and 30 per month.

Downloads from App Store vs Google Play
There are two main places where most smartphone users get their apps. iPhone users download their apps from the Apple App Store, while Android users get their apps from the Google Play Store.
If we look at the number of apps downloaded worldwide, we can see that the Google Play Store has more downloads than the Apple App Store.
However, both stores have seen an increase in the number of downloads from 2019 to 2020. The Google Play Store saw a 31% increase in downloads, while the Apple App Store only saw a 2.5% increase.
This means that the Google Play Store has more installations and is growing at a faster rate. Based on these trends, we can predict that they will continue in 2022.
App Store’s Most Popular Google Play Store Categories
You can measure the success of an app category based on penetration. According to Statista, these are the app categories with the highest penetration rate among Android users.
- Tools — 99.81%
- Communication — 99.93%
- Business Apps — 99.33%
- Video Players & Edit— 96.63%
- Travel & Local — 95.7%
- Social Media Apps — 95.02%
- Productivity — 91.67%
- Music & Audio — 88.38%
- Entertainment — 83.85%
- News & Magazines — 81.11%
- Photography — 75.77%
- Books & Reference — 70.74%
- Lifestyle — 65.67%
- Personalization — 61.62%
- Games (Casual) — 58.86%
- Games (Puzzle) — 56.5%
- Games (Arcade) — 55.08%
- Shopping — 35.79%
- Games (Action) — 34.19%
- Weather — 32.46%
It’s important to be cautious when considering the leading categories of Android apps. For instance, if you take a closer look at the top categories on the list, you’ll notice that some of those apps, like communication apps, are most probably already included in all Android devices by default.
The App Store is dominated by the games sector:
However, unless you intend to create a new application from scratch, you are unlikely to have a game. Consider the case of an internet store. It’s pointless to create a gaming application for your company simply so it can belong to a more prominent category.
Your app category should be appropriate to the app’s goal and functions. So, if you’re trying to attract more downloads for a lifestyle or brand app, you can’t merely label it as a game.
In fact, failing to choose a category for your app’s principal purpose violates the App Store review criteria.
If you break these terms, your app may be withdrawn from the Application Store. If this happens, no one will be able to install your app.
As a result, don’t try to deceive the system. Even if your software isn’t in the top category, it can still be successful. There is higher competition in such categories. You might choose a less saturated specialized sector and strive to command a greater share of a relatively small market, depending on your strategy.
Availability of Apple App Store
As I mentioned earlier, the mobile app industry is highly competitive. But have you ever wondered how many apps actually compete with each other? Let’s take a look at the number of apps available on the Apple App Store.

The number of available apps on the App Store is increasing every year. This is not surprising since more people are using mobile devices than ever before, and app downloads are at an all-time high.
Therefore, it is natural that more apps are being launched in the market.
However, it is difficult to determine whether app download numbers are on the rise because more apps are available or more apps are available because so many more apps have been released. Both arguments can be made.
To get a better understanding of this reasoning, we need to analyze the Google Play Store.
Availability of the Google Play Store
Just completed checking the Apple App Store. Now, I will show you the number of apps present on the Google Play Store.
As you can see from the graph, the number of apps available on the Google Play Store has been continuously increasing since mid-2017, despite a slight dip in app availability during that time.
This is due to the highly competitive nature of the Google Play Store, where only the best apps survive.

However, there is no anticipation of another downward trend in app availability, and the overall trend should continue to rise for the foreseeable future, based on the statistics of the last two years.
It is interesting to note that even though the number of apps available for download on the Google Play Store has decreased slightly, the number of installations is still increasing.
If we compare this with the Apple App Store, the number of apps available on the platform increases annually, but the installation growth rate is smaller than that of the Google Play Store.
From this data, it is reasonable to conclude that the number of apps available on each platform is unrelated to overall app download growth.
App Categories with the Most Downloads on Google Play
The penetration of an application category can be used to assess its success. These are all the application segments with the largest penetration level among Android users, according to Statista.
Tools — 99.81 percent Communication — 99.93 percent Business — 99.33 percent Video Players & Edit — 96.63 percent Travel & Local — 95.7 percent Social — 95.02 percent Productivity — 91.67 percent Music & Audio — 88.38 percent Entertainment — 83.85 percent News & Magazines — 81.11 percent Photography — 75.77 percent Books & Reference — 70.74 percent Lifestyle — 65.67 percent
A few of these categories should be viewed with caution. Take a peek just at the top spots on the list, for example. All Android devices are likely pre-loaded with those applications (such as communication apps).
Besides that, this list gives a decent idea of the kinds of apps that Android phones have installed (apps like Snapchat, Whatsapp, Tinder, Spotify, TikTok, and Netflix).
However, simply having an app loaded on a device does not imply that it is being utilized. As we examine phone app usage statistics, we’ll go over this topic in further detail.
Use of Mobile Apps
Now that you’ve seen how individuals throughout the globe download apps, it’s time to look at how they use them.
- The typical mobile user uses their device for 3 hrs and 10 mins every day. Apps take up roughly 2 hrs & 51 mins of this time (applications make up an estimated 90 percent of smartphone usage).
- According to studies, the average smartphone has around 80 apps installed. However, not everyone is using all of the apps available.
- On average, people use nine smartphone applications a day & 30 per month.
- If the typical mobile consumer has 80 apps, this indicates that more than 62 percent of those apps aren’t used on a monthly basis.
- What exactly does this imply? It’s straightforward. People download applications but never use them. In reality, 25% of apps are only used briefly after being downloaded before being deleted.
- As we progress through this article, we’ll delve further into app usage data.
Retention and Churn in Mobile Apps
As you may already know, just because someone downloads your app doesn’t necessarily mean they will use it regularly.
If you’re struggling to make money from your app despite an initial surge in downloads, this could be the reason. This is a common issue that app owners face, and the best way to measure it is through retention and churn rates.

It’s important to note that 71% of app users stop using an app within the first 90 days of downloading it. This means you need to track these metrics and give users a reason to keep coming back to your app.
While you’ll never achieve 100% retention, you should always be looking for ways to keep existing users engaged while also attracting new downloads.
If your app has glitches, bugs, or poor user experience, people are more likely to stop using it. Even the most popular apps have occasional bugs, but it’s your responsibility to identify and fix these issues. Regular updates and new versions of your app can help improve performance and user experience.

App Use by Age Group
The use of technology varies with every generation. The use of mobile apps is no exception.
You’ve undoubtedly thought that younger generations use mobile apps more than older generations. If that’s the case, you’re right.
That isn’t to say you can’t market to different age groups. Individuals between the age of 45 to 54 spend roughly 1 hr & mins each day using mobile apps, as shown in the graph. That’s only 27 mins less than folks aged 25 to 34.
Even smartphone consumers over 65 years of age spend nearly an hour every day on mobile apps.
Device Usage of Mobile Apps
Not all mobile applications are made equal. Aside from operating system changes, people’s usage will vary depending on the sort of mobile device they use.
Use of Smartphone Apps
There are many ways to access digital content, including smartphones, tablets, desktop PCs, and laptops. Other devices like watches, smart TVs, smart home gadgets, and smart vehicles can also access content and apps.
However, the use of smartphone apps dominates certain sectors. This is because smartphones are the most popular device choice for many activities.

For instance, 96% of map usage in the United States is done through smartphones, while 86% of digital weather content is viewed through smartphone apps.
This is understandable since people need mobile access to maps and GPS services. However, there are some surprising categories where smartphone app usage is high.
For example, 47% of retail spending is done through smartphone apps, despite other online shopping alternatives. Another such category is news and information, where smartphone usage is slightly over 40%, which is still high compared to other platforms and channels available.
Tablets vs smartphones
There are some distinctions between smartphones and tablets.
As previously said, there are twice as many smartphones as tablets on the planet (2.7 bn vs. 1.35 bn). However, tablet usage is catching up to smartphone usage.
On a monthly basis, people download more smartphone apps and use more mobile applications. However, as the diagram shows, tablets aren’t far behind.
Given that smartphones are virtually always within reach, it’s understandable that they would be utilized more frequently.
When it pertains to purchased applications or subscription purchases made through an app, tablets edge out smartphones by a hair. Tablets may continue to dominate this area for many years to come.
Use of Tablets
Tablets are used for certain reasons and are not as popular as smartphones.
Here are some of the most popular tablet app categories.
Another example of gaming being at the top of a usage list. When comparing this chart to the preceding one, it’s clear that a consumer is more eager to spend on gaming apps downloaded on a tablet.
The gameplay & user experience will be better because tablet screens are larger. This is likely why tablet consumers are inclined to pay a higher price for downloads & subscriptions.
Usage of Mobile Apps by Country
Location affects behavior, as it does almost everything else. The same principle applies to app usage.
We’ll look at and analyze how people utilize mobile apps in different regions of the world. You can use this data to learn more about the audience you’re targeting or to spot fresh market opportunities.
Downloads of Apps By Country
Here are the leading application store downloads by major countries throughout the world.
The amount of application installations in China has increased by 80% in the last four years.
However, other growing markets such as Indonesia, Brazil & India are all experiencing rapid expansion. India’s app installation growth rate during the same period is a stunning 190 percent, as shown in the graph. In the United States, only 5% of people are employed.
As technology evolves and becomes more accessible in emerging areas around the world, the possibility of addressing overseas consumers with an app may be attractive to some firms.
App usage per month (in hours)
Let’s look at how much time individuals spend using smartphone applications in different markets throughout the world.
This graph resembles the previous one in many ways. It stands to reason that as app downloads increase in India, consumers would spend much more time using applications.
There is one characteristic that everyone in these countries has in common. Each year, the amount of time spent on smartphone apps increases.
Consider a nation like Italy, which has a far smaller population than India. However, between 2019 and 2020, the average amount of time consumed using apps in both of these areas increased by 30%.
Downloads: Google Play vs Apple (Android vs. iOS) Worldwide
Android has a huge market share worldwide. It’s no surprise that the Google Play Store accounts for a great proportion of app downloads worldwide.
As the graph shows, we are approaching a 50-50 split in the United States. In Japan, Apple App Store subscriptions dominate, whereas Google Play Store downloads rule everywhere else.
FAQs
💡 Which categories of mobile apps are the most popular among users?
Popular app categories include social networking, gaming, shopping, and productivity apps, as they cater to different user preferences and needs.
📈 Are there any emerging app trends or new app categories on the rise?
Emerging trends include augmented reality (AR), virtual reality (VR), and health and fitness apps, reflecting the evolving interests and needs of users.
🤔 What strategies can businesses implement to monetize their mobile apps effectively?
Monetization strategies include in-app advertising, subscription models, in-app purchases, and affiliate marketing, depending on the app's niche and target audience.
🤝 How can businesses collaborate with mobile app developers to create successful apps?
Businesses can partner with app developers to co-create apps that align with their brand and goals, leveraging the developer's expertise in app design and development.
📱 What is the future outlook for mobile apps?
The future of mobile apps may involve greater integration with emerging technologies like AI, AR, and VR, as well as more focus on user privacy and sustainability.
Quick Links:
- Top Facebook Statistics You Need To Know
- Generation Z Statistics, Facts, and Trends
- College Graduation Statistics, Facts and Figures
- Logo Statistics: Stats, Facts, And Trends About Logos That Will Make You Think
Conclusion: Mobile Apps Statistics 2024
Smartphone users spend more time on Mobile apps for social networking, entertainment, and productivity. This growing market provides developers with many opportunities, but competition is fierce.
As technology evolves, mobile app usage is expected to rise, shaping our digital experiences.
However, keeping up with the latest research and trends is essential. Use this guide to understand the mobile app industry, particularly in terms of downloads and usage.
What statistics are you using to track your mobile app’s usage statistics? Let us know in the comment section below.
Sources: Statista, reviews.org, Emarketer, oberlo, techjury, sensortower