Live chat has become an integral part of online communication, offering instant support and assistance to users across various platforms.
Dive into the world of live chat statistics, where you’ll uncover fascinating insights into its usage, effectiveness, and impact on customer experience.
Explore how businesses utilize live chat to engage with customers, resolve queries, and drive sales. From response times to customer satisfaction rates, discover the metrics that shape the success of live chat support.
Explore the statistics and data related to this lively and engaging form of internet-based communication.
| Statistic | Value |
|---|---|
| Cost Efficiency of Chat Support | Companies with chat support pay roughly 15 to 33% less than those with phone support. |
| Decline in Phone Support Usage | Customer service using phone support dropped by 7%. |
| Customer Preference for Live Chat | 42% of customers prefer live chat over phone conversations because they don’t have to wait on hold for an agent. |
| Live Chat Satisfaction Rate | 73% satisfaction rate for live chat. |
| Millennials’ Preference for Live Chat | 63% of millennials prefer live chat for basic customer support queries. |
| Importance of Quick Response | 90% of customers consider a quick response critical when using live chat. |
| Ability to Multitask | 51% of customers appreciate the ability to multitask while using live chat. |
| Live Chat Software Market Projection | Projected to reach USD 1362.54 million by 2027. |
| Business Adoption of Live Chat | About 85% of businesses were expected to opt for live chat support in 2023. |
| Investment in Live Chat Support | 81% of customer service departments plan to invest more in live chat support in the future. |
| Mobile Engagement | Mobile chatters are 6.1 times more likely to convert compared to non-chatters. |
| Live Chat Tickets Ending with Satisfied Customer | 86% of live chat tickets end with a satisfied customer. |
| Impact on Sales, Revenue, and Customer Loyalty | 79% of businesses say offering live chat has positively impacted these areas. |
| Improvement in Conversions | Adding live chat can improve conversions by 12%. |
| Savings from Using Chatbots | Organizations saved an average of $300,000 in 2019 by using chatbots. |
| Immediate Response Expectation | Approximately 66% of customers expect an immediate response to their inquiries. |
| Resolution Speed | Most problems on live chat are resolved in 42 seconds. |
| Preference for Real-Time Online Chat | 42% of customers prefer this method of communication. |
| Annoyance with Scripted Experiences | 29% of customers find scripted live chat experiences annoying. |
| Use of Canned Responses | 69% of companies use canned responses in their live chat service. |
| Purchase Likelihood | 38% of consumers are more likely to buy from a company if they offer live chat support. |
| Customer Expectations for Live Chat | More than 30% of customers expect live chat on a website. |
Editor’s Pick: Live Chat Statistics

Source: Pexels
- In the United States, 69% of buyers want live chat options.
- For customers aged 18 to 49, live chat is the most popular service option.
- Around 73% of clients say live chat is the most convenient way to communicate with a business.
- Millennials are 20% more likely than other generations to use live chat.
- By 2023, the worldwide live chat industry is expected to be worth $987.3 million.
- Clients who have used live chat spend approximately 60% more per transaction than those who don’t.
- Conversion rates increase by 3.84% when using live chat.
- When compared to phone support, live chat costs 15-33% less.
- 73% satisfaction rate for live chat compared to 61% for email and 44% for phone support.
- 90% of customers consider a quick response critical when using live chat.
- 51% of customers appreciate the ability to multitask while using live chat.
- Mobile chatters are 6.1 times more likely to convert compared to non-chatters.

Conversion Statistics for Live Chat

Source: Pexels
Customers who utilize live chat pay up to 60% more for each purchase than customers who do not.
This occurs because customer service can promptly address customer problems and provide answers. Then, after a nice & interactive chat with real-time help, 38% of customers are more likely to purchase a product. (Software Suggestions)
1. Approximately 57% of buyers would abandon an online transaction if their questions were not answered.
Webchat customer care is critical to keeping your customers and completing their orders. More than half of clients will abandon their purchasing basket if they do not receive prompt responses.
On the other hand, 63% of customers indicated they would happily revisit an eCommerce store that included a live chat feature. (Acquire)
2. Conversion rates increase by 3.84% when using live chat.
According to data, the key reason for this is the ability to incorporate some live chat marketing methods. Companies can receive leads for a fraction of the price of doing so on a regular basis.
Sales teams can swoop in and turn leads into customers after the initial engagement between the chat agent and the visitor. Furthermore, some businesses have incorporated customer relationship management tools in place to assist representatives. (Software Suggestions)
3. Virgin Airlines increased conversion rates by 23% after implementing live chat.
According to the company’s live chat performance metrics, chat converts consumers at 3.5 times the rate of individuals who do not use the product. However, there is one point worth highlighting.
Virgin uses this chat to secure additional income and increase average order value rather than using it at the conclusion of the sales funnel. For example, since the company began utilizing live chat, AOV has improved by 15% for those consumers who utilize it against those who don’t. (360° of Digital Commerce)
4. After integrating live chat, Intuit’s conversion rates increased by a whopping 190 percent.
The vendor of QuickBooks and Mint didn’t stop there. Once the chat widget was put on the item comparison page, their sales increased by an astonishing 211 percent.
The addition of a chat widget raised the typical order amount at the checkout page by 43 percent, according to live chat statistics. (Monster Template)
5. Rescue Spa increased revenue by 286% after implementing live chat.
Rescue Spa is a Philadelphia-based boutique spa that specializes in upmarket beauty products and services. The corporation went to the online world at one time and chose to build an eCommerce platform.
They added a new site vendor, improved the checkout procedure, and made the live chat option available. The average annual revenue growth after that was 175 percent.
This is just more evidence that businesses that offer live chat support get greater sales and conversion rates.
6. Improvement in Conversions
The statistic that adding live chat can boost conversions by 12% demonstrates the direct impact of live chat on sales performance.
This increase can be attributed to Living Chat’s ability to provide immediate assistance during the customer’s buying process, addressing queries and concerns in real time, which can significantly influence the decision to purchase.
7. Positive Impact on Sales, Revenue, and Customer Loyalty
The fact that 79% of businesses report positive effects on sales, revenue, and customer loyalty from offering live chat features underscores its value not just as a customer service tool but as a driver of business growth.
Live chat facilitates a more engaging and personalized shopping experience, which can enhance customer satisfaction and encourage repeat business.
8. Influence on Purchasing Decisions
The fact that 38% of consumers are more likely to make a purchase from a company offering live chat support illustrates the importance of live chat in the consumer decision-making process.
The availability of live chat signals to customers that help is readily available, which can make the difference in choosing one company over another.
Customer Satisfaction Metrics of Live Chat
1. Frustration is expressed by 38% of clients due to a poor live chat experience.
The lack of live chat help, being removed from the conversation, or the need to fill in a form to begin the chat are the most common causes of annoyance.
Around 29% of customers find written responses the most irritating, while 24% are upset by excessive wait times. Then, if respondents have to repeat themselves, 9% become frustrated. (Kayakoo)
2. According to live chat statistics, the maximum wait time for a live chat answer is 9 minutes.
Just consider this customer’s annoyance. One of the reasons a consumer ceases to be a consumer of a particular organization is high wait times. Response times for live chat are crucial in the consumer journey.
The average wait time is 2 mins & 40 seconds from the time the consumer initiates the chat. Some agents are able to answer during the first thirty seconds, but not everyone is. Meanwhile, the fastest response time was seven seconds. (Super Office)
3. Only 25.21% of businesses respond to live chat queries.
This is a significant number, and it warrants customers’ skepticism. According to live chat data, the typical wait time for a response is 2 mins and 40 seconds for those who are answered.
Furthermore, 55% of businesses do not provide transcripts or ask for customer comments after the conversation has ended (45%). Another 23% do not even request contact information before starting a discussion. (Super Office)
4. In a live chat, over 69% of companies use canned messages.
Despite customers’ desire for real-time connection and answers to their issues, they may not always receive the “personal touch.”
Despite the distinctiveness that agents bring to the job, according to Jeff Epstein, VP of Product Marketing & Communication at Comm100, they don’t come up with fresh answers every time. All of their comments become increasingly automated & sound pre-recorded after a period. (Forbes)
5. High Satisfaction Rates
The finding that 86% of live chat interactions end with a satisfied customer highlights live chat’s effectiveness in resolving customer issues satisfactorily.
High satisfaction rates are likely due to the immediate and personalized nature of live chat interactions, which meet customers’ expectations for quick and efficient service.
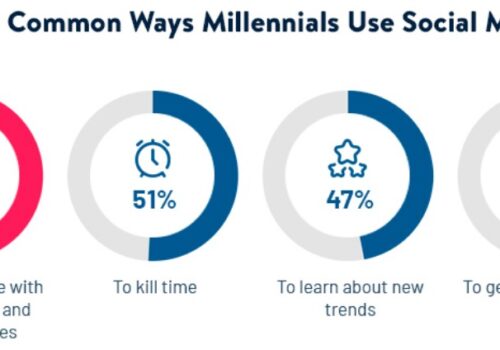
6. Millennials’ Preference for Live Chat
The fact that 63% of millennials prefer live chat for addressing customer support queries indicates a generational shift towards digital communication channels.
Millennials value the speed, convenience, and efficiency of live chat, making it a preferred method of interaction over more traditional channels like phone and email.
7. Preference for Real-Time Online Chat
The preference of 42% of customers for real-time online chat over other communication methods reflects the growing demand for instant and convenient customer service solutions.
Real-time chat allows customers to receive immediate answers to their questions, enhancing their overall experience and satisfaction.
8. Annoyance with Scripted Experiences
The annoyance expressed by 29% of customers towards scripted live chat experiences emphasizes the need for genuine, personalized interactions.
Customers seek authentic communication that addresses their specific needs and concerns rather than generic, automated responses.
9. The expectation for Live Chat Availability
More than 30% of customers expect live chat to be available on a website, which signifies the normalization of live chat as a standard customer service offering.
This expectation reflects the importance of live chat in providing a competitive, customer-centric online experience.
Stats on Live Chat vs Phone Support

Source: Pexels
1. Handling live chat costs less than half as much as handling phone calls.
Based on the experience of organizations with live chat help who previously relied primarily on phone models, this method is far less expensive. Not to add the convenience of using live chat.
In legacy call centers, for example, agents can only respond to a single email or call at a time. An operator can interact with up to six distinct discussions at the same time in customer care with a live chat function.
Call center support on the phone, as per some estimates, costs $12 for each call, as opposed to $5 for a live chat. (Administration)
2. By implementing live chat, Magellan GPS was able to reduce phone call costs by 55.8% between 2013 and 2015.
According to live chat statistics, the company’s contact center spending declined from $1.5 million to $840,000 between 2013 and 2014. Since using a Velaro live chat system, this has decreased by 43% in just one year. It decreased by 22% to $650,000 between 2014 and 2015.
The majority of incoming support requests were redirected to live chat, rendering the phone obsolete. As a result, phone support dropped from 66.9% to 33.1%. (Velaro)
3. Cost Efficiency of Chat Support
Companies that implement chat support experience a significant reduction in operational costs, paying roughly 15 to 33% less than those relying on traditional phone support.
This cost efficiency stems from the ability of live chat systems to handle multiple inquiries simultaneously, reducing the need for a large customer service team dedicated solely to phone support.
4. Decline in Phone Support Usage
In 2021, there was a noticeable 7% drop in customer service interactions via phone support. This decline reflects changing consumer preferences towards more immediate and convenient forms of communication.
As digital channels, including live chat and social media, become more integrated into people’s daily lives, customers increasingly favor these methods for their customer service needs.
The shift away from phone support is also indicative of the broader digital transformation within customer service, where speed and efficiency are paramount.
5. Customer Preference for Live Chat
A significant 42% of customers express a preference for live chat over phone conversations for customer support interactions.
This preference is largely due to the immediate access to help that live chat provides, eliminating the frustration of waiting on hold that is often associated with phone support.
Live chat allows customers to continue with their day while waiting for a response, offering a level of convenience and multitasking that phone support cannot match.
This shift in preference underscores the importance of live chat as a customer service tool that aligns with modern expectations for speed, convenience, and efficiency.
FAQs
📊 How effective is live chat for customer support?
Live chat is highly effective for customer support, with studies showing that it leads to higher customer satisfaction rates, faster query resolution times, and increased conversion rates compared to traditional support channels like email or phone.
💬 What percentage of customers prefer live chat over other support channels?
According to research, around 41% of customers prefer using live chat for support queries, citing convenience, speed, and the ability to multitask as primary reasons for their preference.
⏱️ What is the average response time in live chat interactions?
The average response time in live chat interactions varies depending on factors such as industry standards, agent availability, and customer demand. However, best practices typically recommend responding to live chat inquiries within 30 seconds to one minute.
🌐 How does live chat usage vary across different industries?
Live chat usage varies across industries, with sectors like e-commerce, software, and telecommunications having higher adoption rates due to their emphasis on customer service and online transactions.
📈 How does live chat impact customer satisfaction and retention?
Live chat has a positive impact on customer satisfaction and retention by providing immediate assistance, resolving queries efficiently, fostering positive interactions, and building stronger relationships between businesses and customers.
🚀 What are some best practices for optimizing live chat performance?
Best practices for optimizing live chat performance include ensuring prompt responses, training agents for effective communication, personalizing interactions, integrating chatbots for automation, monitoring performance metrics, and continuously improving the live chat experience.
Quick Links:
- Top Video Marketing Stats
- Social Network Usage Stats
- Millennial Marketing Statistics
- ChatGPT Statistics
- Uber Eats Statistics
- Spotify Statistics
- TikTok Statistics
Conclusion: Live Chat Statistics 2024
Live chat statistics can help businesses understand the effectiveness and impact of this dynamic customer support tool.
A significant percentage of customers prefer live chat over traditional support channels, which can lead to improved customer satisfaction, faster query resolution, and increased conversions.
While managing chat volumes can be a challenge, live chat remains a valuable asset for enhancing customer engagement and retention.
By implementing best practices and optimizing performance, businesses can leverage live chat to provide efficient and personalized support. This can ultimately contribute to a positive customer experience and organizational success.
Sources: Gartner, Investcro, Liveagent, Digital commerce, Hubspot, Superoffice, Emarketer, Zoho, Softwareadvice, MonsterSpot