आपकी वेबसाइट लोड होने में लगने वाला हर मिलीसेकंड, संभावित ग्राहक के आपके साथ व्यापार करने के बारे में पुनर्विचार करने का समय होता है। यह बात सुनने में थोड़ी अटपटी लग सकती है, लेकिन आंकड़े देखने के बाद यह मामूली सी बात लगने लगती है।
2026 में, पेज स्पीड अब कोई "तकनीकी" चिंता नहीं रह जाएगी जो बैकलॉग में चुपचाप पड़ी रहती है। यह एक सर्वोपरि समस्या होगी। राजस्व चालकवेब वाइटल्स, एक सर्च रैंकिंग वेरिएबल है, और तेजी से, किसी भी विज़िटर पर आपके ब्रांड की पहली वास्तविक छाप बन रही है। मोबाइल ट्रैफ़िक अब वैश्विक वेब विज़िट के 62% से अधिक का योगदान दे रहा है और Google ने अपने कोर वेब वाइटल्स की आवश्यकताओं को और सख्त कर दिया है। मार्च 2026 कोर एल्गोरिदम अपडेटएक तेज़ वेबसाइट और एक धीमी वेबसाइट के बीच के अंतर को नज़रअंदाज़ करना अब पहले से कहीं अधिक महंगा साबित हो सकता है।
यह लेख 2026 के लिए पेज स्पीड के सबसे महत्वपूर्ण और नवीनतम आंकड़ों का संकलन प्रस्तुत करता है — लोड टाइम बेंचमार्क और बाउंस रेट डेटा से लेकर एसईओ रैंकिंग सहसंबंध और वास्तविक राजस्व प्रभाव तक। चाहे आप डेवलपर हों, मार्केटर हों या व्यवसायी, ये आंकड़े आपको एक महत्वपूर्ण जानकारी प्रदान करते हैं।
2026 में वेब परफॉर्मेंस की स्थिति: एक संक्षिप्त अवलोकन
विस्तृत आंकड़ों में जाने से पहले, आइए देखते हैं कि 2026 के मध्य तक वेब की स्थिति क्या है:
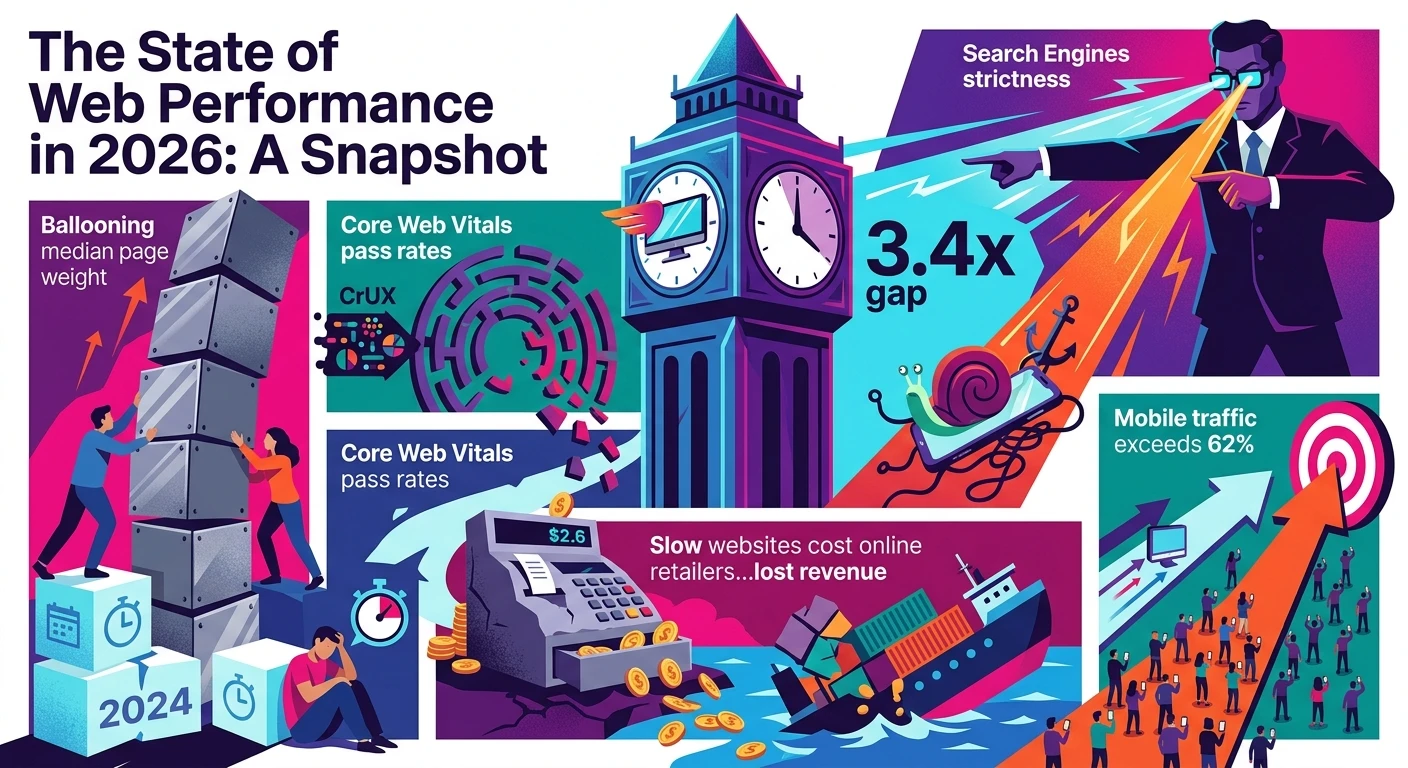
डेस्कटॉप वेबसाइट का औसत लोडिंग समय 2.5 सेकंडजबकि औसत मोबाइल वेबसाइट को चौंका देने वाला समय लगता है। 8.6 सेकंड — यह 3.4 गुना का अंतर व्यवसायों को अरबों डॉलर का नुकसान पहुंचा रहा है।
मोबाइल ट्रैफ़िक इससे अधिक है सभी वेब विज़िट का 62%फिर भी, मोबाइल कोर वेब वाइटल्स के पास होने की दर डेस्कटॉप की तुलना में काफी पीछे है।
केवल मोबाइल ओरिजिन का 42% और डेस्कटॉप मूल के 63% CrUX डेटा के अनुसार, तीनों कोर वेब विटल्स को पास करें।
धीमी वेबसाइटों के कारण ऑनलाइन खुदरा विक्रेताओं को अनुमानित रूप से भारी नुकसान होता है। में $ 2.6 बिलियन वार्षिक राजस्व हानि.
औसत पृष्ठ भार में भारी वृद्धि हुई है। 2.3 एमबी — 2024 से 12% की वृद्धि — जबकि उपयोगकर्ताओं का धैर्य केवल कम हुआ है।
2026 की सबसे बड़ी विडंबना यह है: पेज भारी होते जा रहे हैं, उपयोगकर्ता अधीर होते जा रहे हैं, और सर्च इंजन सख्त होते जा रहे हैं। इन दोनों के मेल से पेज की गति आधुनिक वेब का निर्णायक प्रतिस्पर्धी कारक बन रही है।
औसत लोड समय के मानदंड: आपकी साइट इस मामले में कहां खड़ी है?
आपकी साइट तेज़ है या धीमी, यह समझने के लिए संदर्भ आवश्यक है। लोड होने का समय डिवाइस के प्रकार, कनेक्शन की गति और भौगोलिक स्थान के आधार पर काफी भिन्न होता है। Google CrUX और HTTP Archive डेटा से प्राप्त निम्नलिखित बेंचमार्क यह संदर्भ प्रदान करते हैं।
डिवाइस और कनेक्शन प्रकार के आधार पर:
कनेक्शन प्रकार | औसत लोड समय |
फाइबर ब्रॉडबैंड (100+ एमबीपीएस) | 1.9 सेकंड |
केबल ब्रॉडबैंड (50–100 एमबीपीएस) | 2.5 सेकंड |
5 जी मोबाइल | 1.8 सेकंड |
4जी एलटीई कनेक्शन | 4.7 सेकंड |
डीएसएल (10–25 एमबीपीएस) | 5.2 सेकंड |
3 जी कनेक्शन | 12.4 सेकंड |
धीमी 3जी / उभरते बाजार | 19.2 सेकंड |
मोबाइल और डेस्कटॉप के प्रदर्शन में अंतर ही 2026 में वेब प्रदर्शन की सबसे बड़ी चुनौती है। डेस्कटॉप पेज तेज़ प्रोसेसर, स्थिर कनेक्शन और कम बैकग्राउंड प्रक्रियाओं से लाभान्वित होते हैं। वहीं, मोबाइल पेज कमज़ोर हार्डवेयर, अस्थिर नेटवर्क स्थितियों और भारी जावास्क्रिप्ट पेलोड जैसी चुनौतियों का सामना करते हैं। अधिकांश व्यवसायों के लिए, उनका अधिकांश ट्रैफ़िक मोबाइल के माध्यम से आता है - इसलिए 8.6 सेकंड का औसत मोबाइल लोड समय एक गंभीर समस्या है, न कि मामूली बात।
भूगोल द्वारा:
लोडिंग समय के भौगोलिक पहलू को अक्सर कम करके आंका जाता है। दक्षिण कोरिया में किसी उपयोगकर्ता को आपकी साइट लोड होने में 3.1 सेकंड लग सकते हैं, जबकि दक्षिण-पूर्व एशिया में किसी उपयोगकर्ता को 9.7 सेकंड और उप-सहारा अफ्रीका में किसी आगंतुक को 14.1 सेकंड तक इंतजार करना पड़ सकता है। यदि आपकी होस्टिंग केवल अमेरिका में है, तो यूरोपीय आगंतुकों को 200-400 मिलीसेकंड की अतिरिक्त लेटेंसी झेलनी पड़ती है, जबकि एशिया-प्रशांत क्षेत्र के आगंतुकों को 400-700 मिलीसेकंड अधिक का भुगतान करना पड़ता है - केवल इसलिए कि आपका सर्वर गलत महाद्वीप पर स्थित है।
2026 में उपयोगकर्ताओं की अपेक्षाएं: धैर्य समाप्त हो रहा है
वेबसाइटों से उपयोगकर्ताओं की अपेक्षाओं से संबंधित डेटा अपनी निरंतरता में आश्चर्यजनक है। वर्षों के शोध और हजारों अध्ययनों के बावजूद, धीमी गति से लोड होने वाले पेज के प्रति मानवीय सहनशीलता में शायद ही कोई बदलाव आया है - और अगर कुछ हुआ भी है, तो अल्ट्रा-फास्ट नेटिव ऐप्स के प्रभाव ने उपयोगकर्ताओं को और भी कम सहनशील बना दिया है।
उपयोगकर्ताओं के 47% पेज को लोड होने में दो सेकंड या उससे कम समय लगेगा।
मोबाइल आगंतुकों में से 53% यदि किसी साइट को लोड होने में तीन सेकंड से अधिक समय लगता है तो उसे छोड़ दिया जाएगा।
सभी उपयोगकर्ताओं में से 40% यदि किसी पेज को खुलने में तीन सेकंड से अधिक समय लगता है, तो डिवाइस चाहे कोई भी हो, ऐप बंद हो जाएगा।
उपभोक्ताओं के 70% उनका कहना है कि पेज की गति सीधे तौर पर किसी वेबसाइट से खरीदारी करने के उनके निर्णय को प्रभावित करती है।
ऑनलाइन दुकानदारों का 79% जिन लोगों को प्रदर्शन संबंधी समस्याएं आ रही हैं, उनका कहना है कि वे उस साइट पर वापस नहीं जाएंगे।
उपयोगकर्ताओं के 80% रिपोर्ट में बताया गया है कि धीमी गति से लोड होने वाली वेबसाइट, अस्थायी रूप से बंद वेबसाइट की तुलना में अधिक निराशाजनक होती है - यानी वे पांच सेकंड तक स्पिनर देखने के बजाय एक साफ त्रुटि पृष्ठ देखना पसंद करेंगे।
शायद सबसे महत्वपूर्ण आँकड़ा यह है: जब कोई वेबसाइट धीरे लोड होती है, तो लगभग 50% उपयोगकर्ता पेज को एक बार रिफ्रेश करते हैं, 22% टैब को पूरी तरह बंद कर देते हैं, और 14% सीधे किसी प्रतिस्पर्धी की साइट पर चले जाते हैं।वह आखिरी समूह—14% लोग जो सीधे आपके प्रतिद्वंद्वी के पास जाते हैं—न केवल एक खोई हुई विज़िट का प्रतिनिधित्व करता है, बल्कि परिणाम पृष्ठ पर दूसरे स्थान पर रहने वाले किसी भी व्यक्ति को दिया गया एक उपहार है।
एरिक्सन के एक अध्ययन में पाया गया कि तनाव का स्तर 33% बढ़ जाता है। जब स्क्रीन पर सामग्री प्रदर्शित होने में छह सेकंड से अधिक समय लगता है। वेब प्रदर्शन केवल एक व्यावसायिक समस्या नहीं है; यह एक स्पष्ट रूप से मापने योग्य सार्वजनिक स्वास्थ्य समस्या भी है।
पेज स्पीड और बाउंस रेट: वो आंकड़े जो आपको जगाए रखेंगे
बाउंस रेट, पेज की गति पर उपयोगकर्ताओं की प्रतिक्रिया का सबसे स्पष्ट और सीधा प्रतिबिंब है। यह संबंध लगभग पूरी तरह से रैखिक है: लोड होने में लगने वाले प्रत्येक अतिरिक्त सेकंड से अधिक लोग पेज छोड़ देते हैं।
लोड समय | बाउंस दर | परिवर्तन बनाम 1-सेकंड बेसलाइन |
0–1 सेकंड | 26% तक | आधारभूत |
1-3 सेकंड | 32 - 38% | +23% से +46% |
1-5 सेकंड | 52% तक | + 100% |
1-10 सेकंड | 67% तक | + 158% |
10+ सेकंड | 85% + | +227%+ |
गूगल द्वारा 900,000 मोबाइल विज्ञापन लैंडिंग पेजों के विश्लेषण से प्राप्त मुख्य आँकड़ा वेब प्रदर्शन अनुसंधान में सबसे अधिक उद्धृत आँकड़ों में से एक है: जैसे-जैसे लोड होने का समय 1 सेकंड से बढ़कर 3 सेकंड होता है, बाउंस होने की संभावना 32% बढ़ जाती है। जब किसी पेज को लोड होने में 10 सेकंड लगते हैं, तब तक यह संभावना 123% तक बढ़ जाती है।
इन आंकड़ों का व्यावहारिक अर्थ समझने के लिए एक उदाहरण: एक वेबसाइट जो वर्तमान में 5 सेकंड में लोड होती है और हर महीने 100,000 आगंतुकों को आकर्षित करती है, उनमें से लगभग 50,000 आगंतुक कंटेंट देखने से पहले ही खो जाते हैं। अगर इन खोए हुए आगंतुकों में से केवल 2% भी खरीदारी कर लेते, तो इसका मतलब है कि हर महीने हजारों अवसर हाथ से निकल जाते।
धीमे पेज खुलने से राजस्व पर पड़ने वाला प्रभाव: लागत का आकलन
पेज स्पीड में निवेश करने का सबसे मजबूत तर्क रैंकिंग, बाउंस रेट या उपयोगकर्ता संतुष्टि स्कोर नहीं है। यह पैसा है। और 2026 में, प्रदर्शन अनुकूलन के लिए वित्तीय तर्क डिजिटल मार्केटिंग के इतिहास में किसी भी आंकड़े की तरह स्पष्ट है।
लोडिंग समय के अनुसार रूपांतरण दर:
लोड समय | रूपांतरण दर | राजस्व पर प्रभाव (प्रति साइट $10 मिलियन वार्षिक राजस्व) |
0–1 सेकंड | लगभग 40% (आधाररेखा) | अधिकतम |
1-2 सेकंड | -3% से -7% | प्रति वर्ष -$300K से -$700K तक |
2-3 सेकंड | -7% से -15% | प्रति वर्ष -$700K से -$1.5M तक |
3-5 सेकंड | -15% से -30% | प्रति वर्ष -1.5 मिलियन डॉलर से -3 मिलियन डॉलर तक |
5-10 सेकंड | -30% से -50% | प्रति वर्ष -3 मिलियन डॉलर से -5 मिलियन डॉलर तक |
10+ सेकंड | -50%+ | -$5 मिलियन+ प्रति वर्ष |
इस तालिका के विशिष्ट आंकड़ों को धीरे-धीरे पढ़ना चाहिए:
A पेज लोड होने में 1 सेकंड की देरी से कन्वर्ज़न में 20% तक की कमी आ सकती है। और पेज व्यू में 11% की वृद्धि होती है। प्रत्येक 100ms की अतिरिक्त लेटेंसी के लिए, कन्वर्ज़न लगभग 1% कम हो जाते हैं। गति में 0.1 सेकंड का सुधार कन्वर्ज़न को बढ़ा सकता है। खुदरा स्थलों के लिए 8.4% और यात्रा वेबसाइटों के लिए 10.1%एक सेकंड में लोड होने वाली वेबसाइटें उत्पन्न करती हैं। प्रति उपयोगकर्ता राजस्व 2.5 गुना अधिक उन साइटों की तुलना में जिन्हें लोड होने में पांच सेकंड लगते हैं।
बीबीसी को पता चला कि उसकी वेबसाइट को नुकसान हो रहा है। हर अतिरिक्त सेकंड के लिए इसके 10% आगंतुक वेबसाइट लोड होने में लगने वाला समय - अरबों मासिक पेज व्यू वाले किसी पब्लिशर के लिए यह एक असाधारण आंकड़ा है। अनुमान है कि अमेरिका के बाज़ार में धीमी गति वाली ई-कॉमर्स साइटों को कुल मिलाकर भारी नुकसान उठाना पड़ता है। प्रतिवर्ष 4.2 बिलियन डॉलर का राजस्व.
शायद सबसे सरल सूत्र अमेज़न के मामले के अध्ययन से मिलता है: प्रत्येक 100 मिलीसेकंड की विलंबता के कारण अमेज़न को अपनी बिक्री का 1% नुकसान होता है। 2009 में प्रकाशित उस एक खोज ने वेब परफॉर्मेंस उद्योग की नींव रखी और वह आज भी उतनी ही सटीक है जितनी तब थी।
वास्तविक जीवन के केस स्टडी: गति में सुधार से वास्तविक राजस्व में वृद्धि
उपरोक्त आंकड़े वास्तविक कंपनियों, वास्तविक निर्णयों और वास्तविक परिणामों से जुड़ने पर कहीं अधिक प्रभावी हो जाते हैं।
वोडाफोन यह सबसे बेहतरीन और प्रमाणित गति संबंधी सफलता की कहानियों में से एक है। अपने लार्जेस्ट कंटेंटफुल पेंट को 31% तक बेहतर बनाने के बाद, वोडाफोन ने बिक्री में 8% की वृद्धि, लीड-टू-विजिट दर में 15% का सुधार और कार्ट-टू-विजिट दर में 11% का सुधार देखा। यह पूरा प्रयास एक केंद्रित कोर वेब वाइटल्स ऑप्टिमाइजेशन प्रोजेक्ट था - कोई रीडिजाइन नहीं, कोई नई सुविधाएँ नहीं, बस तेज़ लोडिंग।
स्वेपिरिफर्बिश्ड फोन बेचने वाली एक स्टार्टअप कंपनी ने वर्षों तक परफॉर्मेंस की बजाय नई सुविधाओं को प्राथमिकता दी थी। जब मोबाइल से होने वाली आय डेस्कटॉप से कम होने लगी, तो उन्होंने कोर वेब विटल्स पर सीधे ध्यान दिया। नतीजा: औसत पेज लोड समय में 23% की कमी और एक मोबाइल उपयोगकर्ताओं से राजस्व में 42% की वृद्धि हुई।.
रीनॉल्ट इसके लैंडिंग पेजों पर 10 मिलियन विज़िट का विश्लेषण किया गया, LCP और रूपांतरण दर के बीच एक मजबूत संबंध पाया गया, और LCP को एक सेकंड से कम करने का लक्ष्य निर्धारित किया गया। LCP में एक सेकंड का सुधार होने से बाउंस रेट में 14 प्रतिशत अंकों की कमी और एक रूपांतरणों में 13% की वृद्धि.
Walmart पता चला कि पेज स्पीड में हर 100ms के सुधार के परिणामस्वरूप रूपांतरणों में 2% की वृद्धि और राजस्व में 1% की वृद्धि हुई। अरबों डॉलर की बिक्री करने वाले खुदरा विक्रेता के लिए, ये प्रतिशत बहुत बड़ी रकम दर्शाते हैं।
स्टेपल्स होमपेज के लोड होने का समय एक सेकंड कम करने के लिए CSS और JavaScript को रिफैक्टर किया गया और कन्वर्जन में लगभग 10% का सुधार देखा गया।
Mozilla Firefox इससे औसत पेज लोड समय में 2.2 सेकंड की कमी आई और डाउनलोड कन्वर्ज़न में वृद्धि देखी गई। 15.4% तक .
यह पैटर्न हर उद्योग, हर कंपनी के आकार और आधुनिक वेब के हर युग में एक समान है: तेज़ पेज अधिक पैसा कमाते हैं।
2026 में वेब की मुख्य विशेषताएं: गूगल के परफॉर्मेंस फ्रेमवर्क की व्याख्या
2026 में पेज स्पीड को मापने और बताने के लिए Google का कोर वेब वाइटल्स ही निर्णायक ढांचा बना रहेगा। इसके तीन मुख्य मापदंड हैं:
सबसे बड़ा कंटेंटफुल पेंट (LCP): यह लोडिंग परफॉर्मेंस को मापता है — विशेष रूप से, पेज के मुख्य कंटेंट एलिमेंट को दिखाई देने में कितना समय लगता है। Google का "अच्छा" मानक 2.5 सेकंड से कम है।
नेक्स्ट पेंट (INP) से इंटरेक्शन: मार्च 2024 में फर्स्ट इनपुट डिले (FID) को बदल दिया गया। यह मापता है कि कोई पेज उपयोगकर्ता की प्रतिक्रियाओं पर कितनी जल्दी प्रतिक्रिया देता है। Google की "अच्छा" सीमा 200 मिलीसेकंड से कम है। INP अब सबसे अधिक असफल मीट्रिक वेब पर।
संचयी लेआउट शिफ्ट (सीएलएस): यह दृश्य स्थिरता को मापता है — लोडिंग के दौरान पेज के तत्व कितनी अप्रत्याशित रूप से हिलते हैं। Google का "अच्छा" थ्रेशहोल्ड 0.1 से कम है।
वर्तमान सीडब्ल्यूवी पास दरें (2026):
मैट्रिक | डेस्कटॉप पास दर | मोबाइल पास दर |
एलसीपी (अच्छा: <2.5 सेकंड) | 58% तक | 43% तक |
आईएनपी (अच्छा: <200 मिलीसेकंड) | 78% तक | 65% तक |
सीएलएस (अच्छा: <0.1) | 78% तक | 74% तक |
तीनों संयुक्त | 63% तक | 42% तक |
2025 वेब पंचांग के अनुसार, केवल 48% मोबाइल पेज और 56% डेस्कटॉप पेज ही तीनों कोर वेब विटल्स को पास करते हैं। इसका मतलब है कि तकनीकी रूप से वेब का आधे से ज़्यादा हिस्सा Google के गुणवत्ता मानकों को पूरा नहीं कर पा रहा है। जून 2025 में, 67% वेबसाइटों ने तेज़ LCP स्कोर हासिल किया, जो सार्थक प्रगति दर्शाता है, लेकिन INP मेट्रिक अभी भी सबसे बड़ी बाधा बनी हुई है।
सीएमएस प्लेटफॉर्म (मोबाइल) के अनुसार सीडब्ल्यूवी पास दरें:
सीएमएस प्लेटफॉर्म | CWV पास दर |
Shopify | 64% तक |
Next.js | 58% तक |
Squarespace | 56% तक |
Wix | 49% तक |
WordPress | 38% तक |
जूमला | 31% तक |
Magento | 28% तक |
वर्डप्रेस लगभग 43% वेब को संचालित करता है, फिर भी मोबाइल पर वर्डप्रेस साइटों में से केवल 38% ही तीनों मुख्य वेब मानकों को पूरा करती हैं। यह अंतर इस प्लेटफॉर्म पर चल रहे लाखों व्यवसायों के लिए एक विशाल अवसर और साथ ही एक भारी निरंतर लागत का प्रतिनिधित्व करता है।
पेज स्पीड और एसईओ रैंकिंग: सीधा संबंध
Google ने 2010 से ही पेज स्पीड को रैंकिंग कारक के रूप में आधिकारिक तौर पर पुष्टि कर दी है। 2018 में, यह मोबाइल सर्च रैंकिंग के लिए एक स्पष्ट कारक बन गया। 2021 में, कोर वेब वाइटल्स पेज एक्सपीरियंस सिग्नल का हिस्सा बन गया। और इसके साथ ही मार्च 2026 के कोर अपडेट में, Google ने अपने रैंकिंग एल्गोरिदम में कोर वेब वाइटल्स का महत्व बढ़ा दिया है। काफी।
वास्तविक सर्च इंजन रिजल्ट्स (SERPs) में इसका क्या प्रभाव दिखता है, इस बारे में डेटा काफी जानकारीपूर्ण है:
पहले स्थान पर रैंक करने वाले पृष्ठों का 91% हिस्सा तीनों कोर वेब विटल्स को पास करें।
केवल 47% पेज दूसरे पेज पर रैंक करते हैं। तीनों कोर वेब विटल्स को पास करें।
पहले से तीसरे स्थान पर आने वाले पृष्ठों का माध्यिका एलसीपी है 1.8 सेकंड.
पहले से तीसरे स्थान पर आने वाले पृष्ठों का माध्यिका एलसीपी है 4.2 सेकंड.
शीर्ष 10% सीडब्ल्यूवी प्रदर्शन करने वाली साइटों में औसतन 3.2 स्थान की रैंकिंग का लाभ सबसे निचले 50% से अधिक।
जिन साइटों ने अपने CWV में सुधार किया, उनमें से 34% साइटों की रैंकिंग में 28 दिनों के भीतर बढ़ोतरी देखी गई। सुधार का।
जिन साइटों ने खराब CWV मेट्रिक्स को ठीक किया, उनमें औसतन ऑर्गेनिक ट्रैफ़िक में 12% की वृद्धि.
सीडब्ल्यूवी स्थिति | औसत स्थिति | सीटीआर (पद 1-3) | ऑर्गेनिक ट्रैफ़िक इंडेक्स |
सभी CWV अच्छे हैं | 8.2 | 31.4% तक | 1.00 (आधार रेखा) |
3 में से 2 अच्छे | 11.1 | 24.7% तक | 0.78 |
3 में से 1 अच्छे | 14.6 | 18.2% तक | 0.56 |
सभी सीडब्ल्यूवी खराब | 19.3 | 11.8% तक | 0.34 |
निष्कर्ष स्पष्ट है: जिस साइट पर सभी CWV "अच्छी" श्रेणी में हैं, वह लगभग ऑर्गेनिक ट्रैफिक में 3 गुना वृद्धि किसी साइट की सर्च विजिबिलिटी (CWV) का स्तर "खराब" श्रेणी में होने पर भी, अन्य सभी रैंकिंग कारकों को स्थिर रखते हुए भी, यह कोई मामूली बदलाव नहीं है। यह आपकी सर्च विजिबिलिटी की संरचना में अंतर्निहित एक संरचनात्मक लाभ है।
रैंकिंग में प्रत्यक्ष प्रभाव के अलावा, गति व्यवहार संबंधी मापदंडों के माध्यम से SEO को अप्रत्यक्ष रूप से प्रभावित करती है। तेज़ गति से लोड होने वाले पेजों से बाउंस रेट कम होता है और वेबसाइट पर उपयोगकर्ता ज़्यादा देर तक रहते हैं - ये दोनों ही Google के सिस्टम को गुणवत्ता का संकेत देते हैं। तेज़ी से लोड होने वाले पेजों को Googlebot द्वारा अधिक कुशलता से क्रॉल किया जाता है, क्योंकि Googlebot एक सीमित क्रॉलिंग बजट के भीतर काम करता है और तेज़ गति से लोड होने वाली साइटों पर अधिक बार लौटता है।
उद्योग के अनुसार CWV पास दरें: कौन जीत रहा है और कौन हार रहा है?
विभिन्न उद्योगों में कोर वेब वाइटल्स के प्रदर्शन का वितरण एक असहज सच्चाई को उजागर करता है: जिन क्षेत्रों में राजस्व के लिए गति सबसे अधिक मायने रखती है, वे अक्सर सबसे खराब प्रदर्शन करने वाले क्षेत्र होते हैं।
उद्योग | CWV पास दर | माध्यिका एलसीपी |
समाचार और मीडिया | 61% तक | 2.8s |
प्रौद्योगिकी / SaaS | 57% तक | 3.1s |
शिक्षा | 53% तक | 3.4s |
हेल्थकेयर | 49% तक | 3.7s |
वित्तीय सेवाएँ | 46% तक | 3.9s |
B2B सेवाएँ | 44% तक | 4.1s |
रियल एस्टेट | 41% तक | 4.4s |
eCommerce | 37% तक | 4.8s |
यात्रा और आतिथ्य | 34% तक | 5.2s |
मोटर वाहन | 31% तक | 5.6s |
ई-कॉमर्स — वह उद्योग जिसमें गति और राजस्व के बीच सबसे सीधा और मात्रात्मक संबंध है — प्रदर्शन रैंकिंग में लगभग सबसे नीचे है। ई-कॉमर्स का औसत एलसीपी 4.8 सेकंड है, जो गूगल के "अच्छा" मानक से लगभग दोगुना है। अकेले अमेरिकी बाजार में धीमी ई-कॉमर्स साइटों के कारण अनुमानित वार्षिक राजस्व हानि इतनी है। 4.2 $ अरब.
यात्रा और ऑटोमोबाइल क्षेत्र का प्रदर्शन तो और भी खराब है, जो विशेष रूप से चौंकाने वाला है क्योंकि दोनों उद्योग बड़े पैमाने पर सोच-समझकर खरीदारी करने वाले उपयोगकर्ताओं पर बहुत अधिक निर्भर करते हैं, जिसके लिए विश्वास की आवश्यकता होती है - और जब कोई पेज पांच सेकंड के बाद भी लोड हो रहा हो तो विश्वास बनाना मुश्किल होता है।
मोबाइल स्पीड: वो अंतर जो आपको सबसे ज्यादा नुकसान पहुंचा रहा है
यदि 2026 में किसी एक प्रदर्शन संबंधी कमी पर विशेष ध्यान देने की आवश्यकता है, तो वह है मोबाइल की गति में अंतर। मोबाइल उपकरण अब सभी वेब ट्रैफ़िक का 62% से अधिक उत्पन्न करते हैं, फिर भी मोबाइल पर लोड होने का समय औसतन डेस्कटॉप की तुलना में 3.4 गुना धीमा है।
मोबाइल पर उपयोगकर्ता व्यवहार डेटा विशेष रूप से हानिकारक है:
मोबाइल उपयोगकर्ताओं में से 53% ऐसी साइटों को छोड़ देते हैं जिन्हें लोड होने में 3 सेकंड से अधिक समय लगता है।
मोबाइल पेज औसतन इतना समय लेते हैं लोड होने में 70.9% अधिक समय लगता है डेस्कटॉप पेजों की तुलना में।
70% मोबाइल लैंडिंग पेजों पर, इसमें इतना समय लगता है 7 सेकंड पृष्ठ के ऊपरी भाग में सभी दृश्य सामग्री को पूरी तरह से लोड करने के लिए।
जब मोबाइल लोड होने का समय 1 सेकंड से बढ़कर 10 सेकंड हो जाता है, तो बाउंस होने की संभावना बढ़ जाती है। 123% तक .
लगभग 28% मोबाइल उपयोगकर्ता किसी भी वेबसाइट के लोड होने के लिए 5 सेकंड से अधिक इंतजार नहीं करेंगे।
आईफोन उपयोगकर्ता विशेष रूप से अधीर होते हैं: iOS उपयोगकर्ताओं में से 64% 3 सेकंड से अधिक प्रतीक्षा नहीं करेगा।
लगभग 4 में से 3 मोबाइल उपयोगकर्ताओं ने धीमी गति से लोड होने वाली वेबसाइट का अनुभव किया है - जिससे यह सबसे आम ऑनलाइन परेशानियों में से एक बन गई है।
एक सेकंड में लोड होने वाली मोबाइल साइटें उत्पन्न करती हैं प्रति उपयोगकर्ता राजस्व 2.5 गुना अधिक उन लोगों की तुलना में जिन्हें पांच सेकंड लगे।
मोबाइल परफॉर्मेंस की चुनौती इस तथ्य से और भी जटिल हो जाती है कि कई संगठन पहले डेस्कटॉप अनुभव को बेहतर बनाते हैं और मोबाइल को गौण मानते हैं। यह देखते हुए कि मोबाइल ही वह प्लेटफॉर्म है जहां अधिकांश उपयोगकर्ता आते हैं और जहां परित्याग दर सबसे अधिक है, यह प्राथमिकता देना गलत है।
होस्टिंग, सीडीएन और अवसंरचना: गति की नींव
फ्रंट-एंड ऑप्टिमाइज़ेशन शुरू होने से पहले होस्टिंग इंफ्रास्ट्रक्चर ही परफॉर्मेंस की अधिकतम सीमा निर्धारित करता है। टाइम टू फर्स्ट बाइट (टीटीएफबी) — यानी किसी उपयोगकर्ता द्वारा पेज का अनुरोध करने और सर्वर द्वारा प्रतिक्रिया का पहला बाइट भेजने के बीच का विलंब — सीधे होस्टिंग की गुणवत्ता से निर्धारित होता है और इसका प्रभाव हर डाउनस्ट्रीम मेट्रिक पर पड़ता है।
होस्टिंग प्रदर्शन तुलना (2026):
होस्टिंग प्रदाता / सीडीएन | माध्यिका टीटीएफबी | CWV पास दर |
वर्सेल (किनारा) | 120ms | 68% तक |
क्लाउडफ्लेयर पेज | 140ms | 65% तक |
नेटलिफ़ाई (एज) | 160ms | 62% तक |
AWS क्लाउडफ्रंट + S3 | 180ms | 59% तक |
गूगल क्लाउड सीडीएन | 190ms | 57% तक |
डिजिटलओशन ऐप प्लेटफ़ॉर्म | 320ms | 48% तक |
पारंपरिक वीपीएस | 450ms | 41% तक |
शेयर्ड होस्टिंग (GoDaddy/Bluehost) | 820ms | 29% तक |
एज-आधारित प्लेटफॉर्म और शेयर्ड होस्टिंग के बीच 6.8 गुना TTFB का अंतर उद्योग में सबसे महत्वपूर्ण और कम चर्चित प्रदर्शन कारकों में से एक है। शेयर्ड होस्टिंग पर किसी साइट की CWV पास दर 29% होती है; जबकि एज प्लेटफॉर्म पर वही साइट 65-68% तक पहुंच सकती है। यह कोई ऑप्टिमाइजेशन नहीं है; यह एक इंफ्रास्ट्रक्चर संबंधी निर्णय है।
कंटेंट डिलीवरी नेटवर्क (सीडीएन) अब परफॉर्मेंस स्टैक का एक मानक हिस्सा बन गए हैं, शीर्ष 10,000 वेबसाइटों में से 73% सीडीएन का उपयोग कर रही हैं। सीडीएन को अपनाने से सिंगल-ओरिजिन सर्वर पर होस्ट की गई साइटों के लिए लाइफटाइम कंडक्टिविटी (एलसीपी) में 52% तक सुधार हो सकता है। 20-50 डॉलर के मासिक निवेश से सीडीएन भौगोलिक लेटेंसी के कारण होने वाली उस समस्या को खत्म कर सकता है, जिसके चलते अंतरराष्ट्रीय आगंतुकों को प्रत्येक पेज लोड पर 200-700 मिलीसेकंड का नुकसान होता है।
धीमी पेजिंग के तकनीकी कारण: सबसे पहले क्या ठीक करें
पेजों की गति धीमी होने के कारणों को समझना, उन्हें ठीक करने का पहला कदम है। सबसे आम कारण अच्छी तरह से ज्ञात हैं:
छावियां वेबपेज के कुल आकार का लगभग 78% हिस्सा इमेज का होता है। औसतन, एक वेबपेज में लगभग 21 इमेज होती हैं जिनका कुल आकार 1.9 MB होता है। इमेज अपलोड करने से पहले उनका आकार ठीक से बदलने से पेज लोड होने में लगने वाला समय कम हो सकता है। 1.54 सेकंड तेजी सेऔर लगभग 10% वेब पेज अपनी छवियों को संपीड़ित करके 1 एमबी बचा सकते हैं।
जावास्क्रिप्ट पेलोड इनका औसत आकार बढ़कर 468 KB हो गया है, और जावास्क्रिप्ट के प्रदर्शन में आने वाली समस्याएं खराब INP स्कोर का मुख्य कारण हैं। तृतीय-पक्ष स्क्रिप्ट अब इसका एक बड़ा हिस्सा हैं। कुल पृष्ठ भार का 34% विज्ञापन नेटवर्क, चैट विजेट, एनालिटिक्स टैग और ए/बी टेस्टिंग टूल सामूहिक रूप से लोडिंग समय में सेकंड जोड़ते हैं जबकि उपयोगकर्ता अनुभव में उनका योगदान बहुत कम होता है।
रेंडर-ब्लॉकिंग संसाधन बड़े CSS बंडल और अनडेफ़र्ड फ़ॉन्ट्स, HTML रिस्पॉन्स तेज़ होने पर भी फर्स्ट कंटेंटफुल पेंट में देरी करते हैं। पेज का समग्र भार कम करने से लोड टाइम में 50% तक सुधार हो सकता है। 50% तक .
सर्वर प्रतिक्रिया समय (TTFB) आधारभूत मान है। 820ms का धीमा TTFB (जो आमतौर पर शेयर्ड होस्टिंग में होता है) का मतलब है कि ब्राउज़र किसी भी कंटेंट को लोड या प्रोसेस करने से पहले लगभग एक सेकंड तक रेंडरिंग शुरू नहीं कर सकता।
चरम यातायात की घटनाएं ई-कॉमर्स पर इसका असमान रूप से प्रभाव पड़ता है: लगभग 50% ई-कॉमर्स उपयोगकर्ताओं ने ब्लैक फ्राइडे या छुट्टियों की बिक्री जैसे उच्च-ट्रैफ़िक अवधि के दौरान वेबसाइट के धीमे प्रदर्शन का अनुभव किया है।
गति अनुकूलन का निवेश पर प्रतिफल: यह आपके लिए सबसे अधिक प्रतिफल देने वाला निवेश क्यों है?
स्पीड ऑप्टिमाइजेशन की एक ऐसी विशेषता है जो इसे लगभग हर दूसरे डिजिटल मार्केटिंग निवेश से अलग करती है: यह उपयोगकर्ता के अनुभव को बेहतर बनाता है। आपके मौजूदा ट्रैफ़िक का 100% एक साथबिना किसी अतिरिक्त लागत के।
साइट के प्रकार के अनुसार गति अनुकूलन पर रिटर्न ऑन इन्वेस्टमेंट (2026):
साइट का प्रकार | सामान्य अनुकूलन लागत | वार्षिक राजस्व लाभ | प्रथम वर्ष का ROI | ऋण वापसी की अवधि |
ईकॉमर्स (10 मिलियन डॉलर राजस्व) | $10K–$15K | $500K–$1.5M | 3,300 - 10,000% | 1-2 सप्ताह |
ईकॉमर्स (1 मिलियन डॉलर राजस्व) | $5K–$10K | $50K–$150K | 500 - 1,500% | 2-4 सप्ताह |
लीड पीढ़ी | $5K–$8K | $30K–$80K | 375 - 1,000% | 3-6 सप्ताह |
सास उत्पाद | $8K–$12K | $40K–$120K | 333 - 1,000% | 4-8 सप्ताह |
सामग्री / मीडिया | $3K–$6K | $15K–$40K | 250 - 667% | 4-10 सप्ताह |
व्यावसायिक मामलों के लिए सामान्य नियम: वार्षिक राजस्व में प्रत्येक 10 मिलियन डॉलर के लिए, लोड समय में 100 मिलीसेकंड का सुधार लगभग 100 हजार डॉलर का अतिरिक्त वार्षिक राजस्व उत्पन्न करता है। एक वेबसाइट जो सालाना 1 मिलियन डॉलर का कारोबार करती है, उसी 100 मिलीसेकंड के सुधार के लिए सालाना राजस्व में 10 डॉलर की वृद्धि की उम्मीद कर सकती है - जिसे हासिल करने में लागत उसका एक अंश ही आती है।
इन असाधारण प्रतिफलों के बावजूद, केवल लगभग केवल 3% मार्केटर्स का कहना है कि वेबसाइट की गति में सुधार करना उनकी मुख्य प्राथमिकता है।डिजिटल मार्केटिंग में यह सबसे चौंकाने वाली विसंगतियों में से एक है - और जो कोई भी इसे प्राथमिकता देने को तैयार है, उसके लिए यह सबसे स्पष्ट प्रतिस्पर्धी अवसरों में से एक है।
कोर वेब विटल्स थ्रेशहोल्ड: 2026 में "अच्छा" का क्या अर्थ है?
व्यवहारिक संदर्भ के लिए, यहां प्रत्येक कोर वेब वाइटल के लिए Google के वर्तमान "अच्छा," "सुधार की आवश्यकता है," और "खराब" मानदंड दिए गए हैं:
मैट्रिक | अच्छा | सुधार की जरूरत | दरिद्र |
एलसीपी (सबसे बड़ा कंटेंटफुल पेंट) | ≤ 2.5s | 2.5s - 4.0s | > 4.0 का दशक |
आईएनपी (अगले पेंट के लिए इंटरेक्शन) | ≤ 200 मी | 200ms - 500ms | > 500 मिलीसेकंड |
सीएलएस (संचयी लेआउट शिफ्ट) | ≤ 0.1 | 0.1 – 0.25 | > 0.25 |
टीटीएफबी (पहली बाइट का समय) | ≤ 800 मी | 800ms - 1800ms | > 1800 मिलीसेकंड |
एफ.सी.पी. (पहला कंटेंटफुल पेंट) | ≤ 1.8s | 1.8s - 3.0s | > 3.0 का दशक |
भविष्य में, Google द्वारा 2028 तक इन मानकों को और सख्त करने की उम्मीद है — जिसमें "अच्छा" LCP मानक 2.0 सेकंड और INP मानक 150 मिलीसेकंड तक कम हो सकता है। जो साइटें आज बस पास हो रही हैं, वे दो साल में फेल हो सकती हैं यदि वे प्रदर्शन को एक बार का समाधान मानकर चलें, न कि निरंतर अनुशासन के रूप में।
वेब परफॉर्मेंस किस दिशा में आगे बढ़ रहा है: 2026-2028 के अनुमान
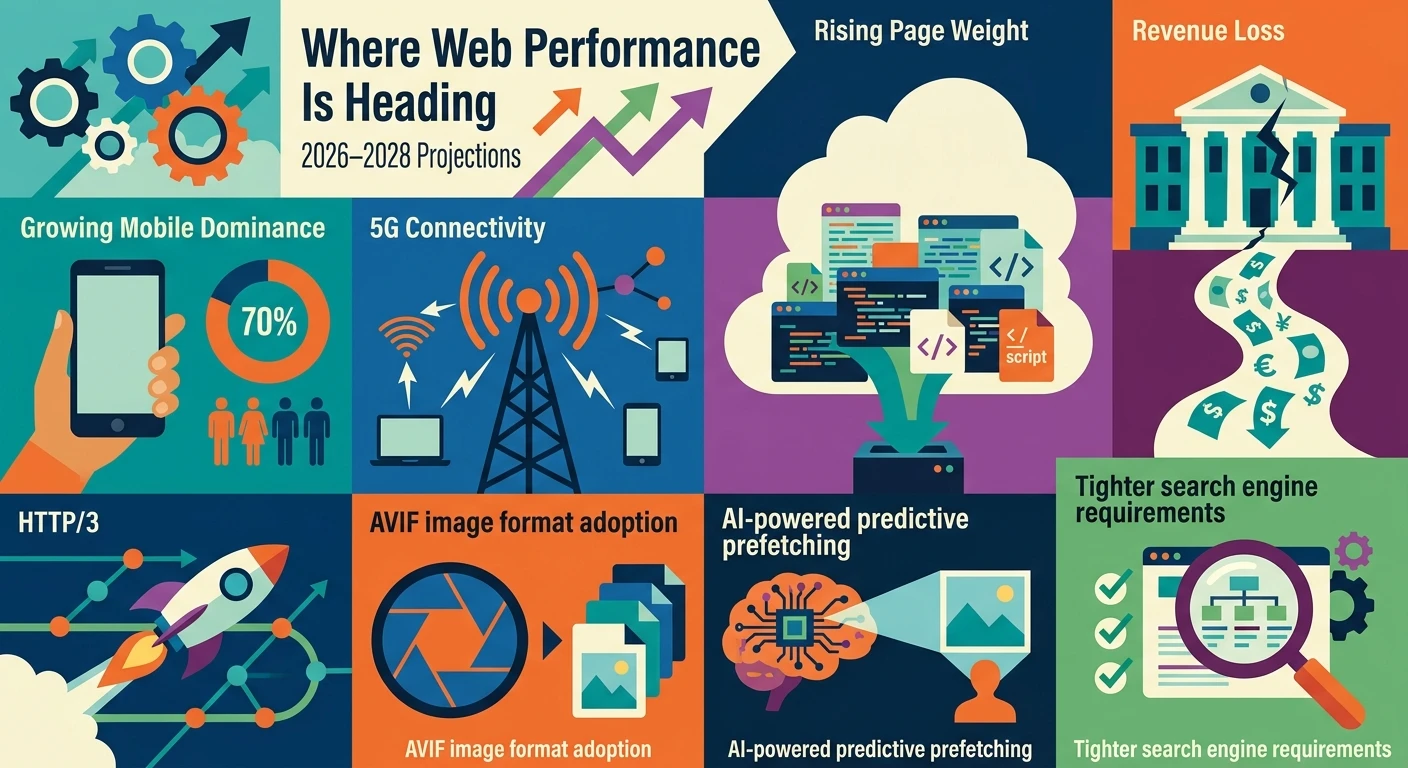
अगले दो वर्षों में वेब प्रदर्शन की दिशा कई कारकों के संयोजन से निर्धारित होगी: सर्च इंजन की सख्त आवश्यकताएं, मोबाइल का बढ़ता प्रभुत्व, उपयोगकर्ताओं की बढ़ती अपेक्षाएं और नई अवसंरचना प्रौद्योगिकियां।
मोबाइल ट्रैफिक के इतना होने का अनुमान है 2028 तक सभी वेब विज़िट का 70% हिस्सा.
5G के पहुंचने की उम्मीद है वैश्विक स्तर पर मोबाइल कनेक्शनों का 56% हिस्सा 2028 तक - जिससे प्रदर्शन का न्यूनतम स्तर तो बढ़ेगा ही, साथ ही उपयोगकर्ताओं की अपेक्षाएं भी बढ़ेंगी।
औसत पृष्ठ भार के इस स्तर तक पहुंचने का अनुमान है 2028 तक 3.1 एमबीजावास्क्रिप्ट फ्रेमवर्क और थर्ड-पार्टी स्क्रिप्ट के लगातार बढ़ते रहने के कारण, 2026 से इसमें 35% की वृद्धि होगी।
धीमी वेब परफॉर्मेंस के कारण वैश्विक स्तर पर सालाना राजस्व में होने वाला नुकसान अनुमानित रूप से इतना हो सकता है। 18 द्वारा 2028 अरब $.
HTTP/3, जिसे वर्तमान में 31% वेबसाइटें सपोर्ट करती हैं, कनेक्शन सेटअप समय को 33% तक कम कर देता है और इसका व्यापक रूप से उपयोग किया जाएगा।
AVIF इमेज फॉर्मेट का उपयोग, जो वर्तमान में 14% है, WebP की तुलना में 50% छोटी फाइलें प्रदान करता है और तेजी से बढ़ रहा है।
एआई-संचालित प्रेडिक्टिव प्रीफेचिंग — जो उपयोगकर्ता के क्लिक करने से पहले पेज लोड करने के लिए मशीन लर्निंग का उपयोग करती है — यह दर्शा रही है कि गति की अनुभूति में 40% सुधार प्रारंभिक तैनाती में।
Google के CWV रैंकिंग भार में अपेक्षित वृद्धि होने की उम्मीद है। 3 गुना वृद्धि 2028 तक वर्तमान स्तरों के सापेक्ष।
स्थिति स्पष्ट है: वेब का भार बढ़ता जा रहा है और उपयोगकर्ताओं की अपेक्षाएँ भी बढ़ती जा रही हैं। जो संगठन प्रदर्शन को उत्पाद की निरंतर प्राथमिकता मानते हैं, वे अपनी प्रतिस्पर्धात्मक बढ़त को और मजबूत करेंगे। वहीं, जो संगठन इसे एक बार की सफाई मानकर चलते हैं, वे हर साल पिछड़ते चले जाएंगे।
व्यावहारिक मानदंड: आपकी वेबसाइट का लक्ष्य क्या होना चाहिए?
2026 के आंकड़ों के आधार पर, प्रतिस्पर्धी उत्कृष्टता को दर्शाने वाले प्रदर्शन लक्ष्य इस प्रकार हैं:
एलसीपी: 2.5 सेकंड से कम (शीर्ष रैंकिंग वाले पृष्ठों से मेल खाने के लिए 1.8 सेकंड से कम का लक्ष्य)
आईएनपी: 200 मिलीसेकंड से कम (शीर्ष 25% में रहने के लिए 100 मिलीसेकंड से कम का लक्ष्य)
सीएलएस: 0.1 के तहत
टीटीएफबी: 800ms से कम (एज-डिप्लॉयड साइटों के लिए 200ms से कम का लक्ष्य)
एफसीपी: 1.8 सेकंड से कम
कुल पृष्ठ भार: 1.5 एमबी से कम (मोबाइल के लिए लक्ष्य 1 एमबी से कम)
HTTP अनुरोधों की संख्या: प्रति पेज लोड 50 से कम (वर्तमान में औसत 87 है)
जावास्क्रिप्ट पेलोड: 300 KB से कम (वर्तमान में औसत 468 KB है)
यदि आपकी वेबसाइट मोबाइल पर 3-5 सेकंड में लोड हो रही है और दो या तीन मुख्य वेब मानकों को पूरा नहीं कर पा रही है, तो आप अपनी ऑर्गेनिक रैंकिंग खो रहे हैं, प्रति अधिग्रहण लागत ज़रूरत से ज़्यादा चुका रहे हैं, और हर दिन कन्वर्ज़न से होने वाली आय का नुकसान कर रहे हैं। अच्छी खबर यह है कि आगे का रास्ता स्पष्ट है: अपने TTFB (टाइम टू बी फुट) और होस्टिंग सेटअप की जांच करें, छवियों को कंप्रेस और रीसाइज़ करें, गैर-ज़रूरी जावास्क्रिप्ट को स्थगित करें, रेंडरिंग में बाधा डालने वाले संसाधनों को हटा दें, और कृत्रिम प्रयोगशाला परीक्षणों के बजाय वास्तविक उपयोगकर्ता डेटा के साथ निगरानी करें।
निष्कर्ष: गति कोई तकनीकी मापदंड नहीं है — यह एक व्यावसायिक निर्णय है।
2026 के पेज स्पीड के आंकड़े एक स्पष्ट निष्कर्ष पर पहुंचते हैं: आपकी वेबसाइट का लोड टाइम रैंकिंग, ट्रैफिक और राजस्व बढ़ाने के सबसे प्रभावी तरीकों में से एक है। लोड टाइम में हर एक सेकंड की बचत आपको कम बाउंस रेट, बेहतर कन्वर्जन, बेहतर सर्च विजिबिलिटी और मजबूत यूजर लॉयल्टी के रूप में वापस दिलाती है।
ये आंकड़े इतने सटीक हैं कि किसी भी चर्चा में इनका इस्तेमाल करके व्यावसायिक तर्क प्रस्तुत किया जा सकता है। 100 मिलीसेकंड के सुधार से कन्वर्ज़न में 1% की वृद्धि। कोर वेब विटल्स की कमियों को दूर करने से ऑर्गेनिक ट्रैफ़िक में 12% की वृद्धि। पेज लोड टाइम में 23% सुधार से मोबाइल राजस्व में 42% की वृद्धि। ये सैद्धांतिक अनुमान नहीं हैं — ये वोडाफ़ोन से लेकर स्वैपी और रेनॉल्ट जैसी वास्तविक कंपनियों द्वारा प्राप्त परिणाम हैं।
यह तथ्य कि वर्तमान में केवल 3% विपणनकर्ता ही गति को अपनी मुख्य प्राथमिकता मानते हैं, इस मीट्रिक के महत्व पर कोई टिप्पणी नहीं है। यह किसी भी व्यवसाय के लिए एक खुला अवसर है जो इसका लाभ उठाने को तैयार है।
अक्सर पूछे जाने वाले प्रश्न
जी हां, Google आधिकारिक तौर पर कोर वेब विटल्स — LCP, INP और CLS — को रैंकिंग सिग्नल के रूप में उपयोग करता है, और मार्च 2026 के कोर अपडेट में इनका महत्व काफी बढ़ गया है। डेटा से पता चलता है कि पहले स्थान पर रैंक करने वाले 91% पेज तीनों कोर वेब विटल्स को पूरा करते हैं, जबकि दूसरे स्थान पर आने वाले पेजों में यह आंकड़ा केवल 47% है।
डेस्कटॉप पर 2.5 सेकंड से कम और मोबाइल पर 3 सेकंड से कम का LCP लक्ष्य रखें, लेकिन शीर्ष रैंकिंग के लिए प्रतिस्पर्धा करने हेतु 1.8 सेकंड या उससे कम का लक्ष्य रखें। आपका TTFB 800ms से कम रहना चाहिए और कुल पेज का आकार आदर्श रूप से 1.5 MB से कम होना चाहिए।
एक वेबसाइट जो सालाना 10 मिलियन डॉलर कमाती है, उसके लिए हर 100 मिलीसेकंड का अतिरिक्त लोड समय लगभग 100 डॉलर के राजस्व नुकसान का कारण बनता है। एक सेकंड की देरी से कन्वर्ज़न 20% तक कम हो जाते हैं, और अमेरिका के बाज़ार में धीमी गति से चलने वाली ई-कॉमर्स साइटों को मिलाकर सालाना लगभग 4.2 बिलियन डॉलर का राजस्व नुकसान होता है।
मोबाइल पेज डेस्कटॉप की तुलना में औसतन 70.9% धीमे लोड होते हैं, जिसका कारण डिवाइस के कमज़ोर प्रोसेसर, अस्थिर नेटवर्क कनेक्शन और भारी जावास्क्रिप्ट पेलोड है जो मोबाइल सीपीयू पर अत्यधिक दबाव डालते हैं। अकेले थर्ड-पार्टी स्क्रिप्ट कुल पेज वेट का 34% हिस्सा होती हैं, और CDN या उचित स्क्रिप्ट प्रबंधन के बिना यह अंतर और भी बढ़ जाता है।
सबसे प्रभावी समाधान हैं छवियों को संपीड़ित और आकारबद्ध करना, तेज़ होस्टिंग पर स्विच करना या सीडीएन जोड़ना, और गैर-जरूरी जावास्क्रिप्ट और तृतीय-पक्ष स्क्रिप्ट को स्थगित करना। ब्राउज़र कैशिंग को सक्षम करने और सीएसएस और जेएस फ़ाइलों को छोटा करने से अधिकांश वेबसाइटों पर लोड होने का समय सामूहिक रूप से 1-3 सेकंड तक कम हो सकता है।