Every few weeks a new prediction lands claiming AI will wipe out millions of jobs. The trouble is that most of these forecasts measure what AI could do, not what it is doing. Anthropic’s 2026 research changed that by measuring real usage, and when you line its findings up next to Stanford’s payroll data and Anthropic’s own Economic Index, a clearer and more grounded picture emerges.
This article gathers the most important AI and jobs statistics from those primary sources. Every figure is tied back to a published study, so you get the actual numbers rather than the headline panic. Here is what the data shows about which jobs are exposed, how people really use AI at work, and whether any of it is showing up in employment yet.
Sekilas Statistik Utama
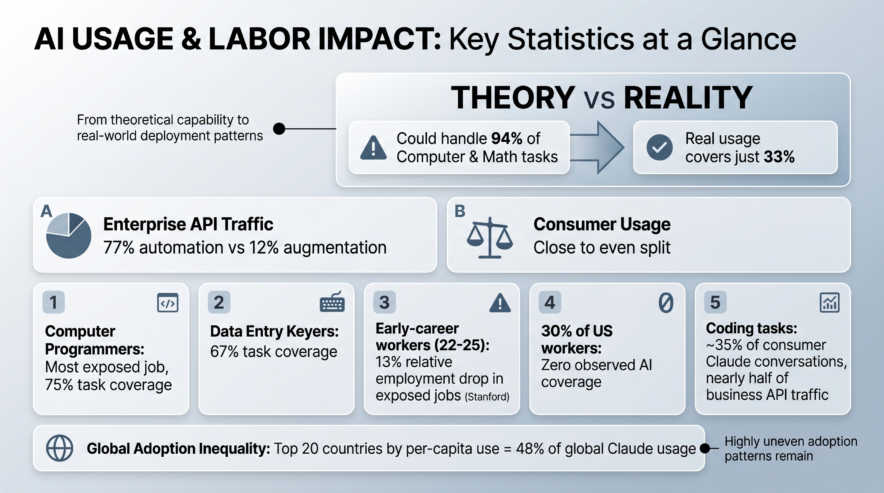
AI could theoretically handle 94% of Computer and Math tasks, but real usage covers just 33% of them.
On enterprise API traffic, 77% of usage is automation versus only 12% augmentation, while consumer usage stays close to an even split.
The single most exposed job is Computer Programmer, with 75% task coverage; Data Entry Keyers sit at 67%.
Early-career workers aged 22 to 25 in the most AI-exposed jobs saw a 13% relative drop in employment, according to Stanford.
30% of US workers show zero observed AI coverage in the usage data.
Coding tasks make up around 35% of all consumer Claude conversations and nearly half of business API traffic.
The top 20 countries by per-capita use account for 48% of global Claude usage, showing how uneven adoption still is.
Where the Numbers Come From
These statistics draw on three connected bodies of research, all using real data rather than surveys or guesswork.
The first is Anthropic’s March 2026 report, “Labor Market Impacts of AI,” which introduces a metric called observed exposure. It blends theoretical capability scores with actual Claude usage to measure how much of each job AI is really doing. The second is the Anthropic Economic Index, a running series that tracks usage patterns across tasks, occupations, and countries. The third is Stanford’s “Canaries in the Coal Mine,” a study by Erik Brynjolfsson and colleagues that analyzed payroll records from ADP, the largest payroll provider in the US.
Together these give two angles on the same question. Anthropic shows what AI is being used for, and Stanford shows whether that use is moving employment numbers. The fact that they broadly agree is what makes the picture credible.
The Theoretical vs Real-World Gap
The central finding across all this work is that AI’s real footprint is far smaller than its potential. Anthropic reports that in Computer and Math occupations, AI could theoretically perform 94% of tasks, yet observed usage covers only 33%. Office and Administrative work shows a similar story, with theoretical capability near 90% but real adoption trailing well behind.
This gap holds even where AI is most popular. Coding is the most common use of Claude by a wide margin, but at the occupation level it still sits at roughly a third of tasks covered. Adoption lags capability because of model limits, legal rules, software needs, and the human checks that slow real-world rollout. The takeaway is that capability and deployment are two very different things, and the distance between them is the story.
How People Actually Use AI: Augmentation vs Automation
One of the richest datasets here is how people divide work with AI. Anthropic splits usage into augmentation, where AI helps a human do a task, and automation, where AI completes the task with little human involvement.
On the consumer side, the balance sits close to even and has flipped back and forth, with augmentation slightly ahead at around 52% versus 45% in recent reporting. Business use looks completely different. In first-party API traffic, automation dominates at 77% against just 12% augmentation, and 97% of tasks show automation-leaning patterns on the API compared to 47% on the consumer app.
The trend over time leans toward more hands-off use. The share of directive conversations, where users hand Claude a task and let it run, climbed from 27% in late 2024 to 39% in a later sample. Since businesses automate far more than consumers, the heavy API usage is the part economists watch most closely for future labor effects.
Mode Penggunaan | Consumer (Claude.ai) | Bisnis (API) |
Automation-leaning tasks | 47% | 97% |
Overall automation share | Tentang 45% | 77% |
Overall augmentation share | Tentang 52% | 12% |
Where AI Use Concentrates: Tasks and Geography
AI usage is far from evenly spread. Out of more than 3,000 unique work tasks seen on Claude, the ten most common accounted for about 24% of all conversations, though that fell to 19% in early 2026 as heavy coding work shifted onto the API and Claude Code. Computer and Math tasks alone make up roughly 35% of consumer conversations and close to half of business traffic.
Geography is just as lopsided. The US, India, Japan, the UK, and South Korea lead in overall Claude use, and the top 20 countries by population-adjusted usage represent about 48% of all activity, up from 45%. Worldwide, adoption tracks closely with income per person. Interestingly, people in lower-use countries lean on AI to automate work more often than those in heavy-use countries do.
There is also a measure of how broadly AI has spread inside jobs. Anthropic found that 49% of all occupations had seen at least a quarter of their tasks performed using Claude, a figure that has held fairly steady in recent data.
The Most and Least Exposed Jobs
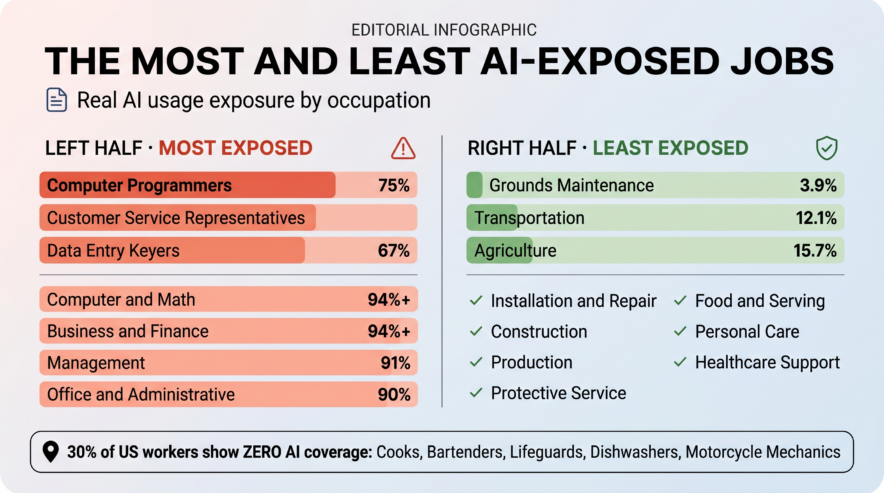
Zooming into specific occupations, three sit at the very top of the exposure list. Computer Programmers lead with 75% of tasks covered by real AI usage. Customer Service Representatives come next as their core work increasingly runs through business API traffic. Data Entry Keyers follow at 67%, since reading documents and entering data is heavily automated.
By broad category, theoretical exposure is highest in Computer and Math and Business and Finance, both above 94%, followed by Management at 91% and Office and Administrative at 90%. At the other end, physical and care work is barely touched. Grounds Maintenance is the least exposed category in the whole study at just 3.9% theoretical coverage, with Transportation at 12.1% and Agriculture at 15.7%.
The safest categories overall are hands-on roles like Installation and Repair, Construction, Agriculture, Transportation, Production, Protective Service, Food and Serving, Grounds Maintenance, Personal Care, and healthcare support roles. And 30% of US workers show zero AI coverage, including Cooks, Bartenders, Lifeguards, Dishwashers, and Motorcycle Mechanics.
Early Signs in Employment Data
Here the two research camps offer a useful tension. Anthropic found no systematic rise in unemployment for highly exposed workers since late 2022. The gap between the most and least exposed groups was small and statistically indistinguishable from zero.
Stanford’s payroll study found something sharper at the entry level. Early-career workers aged 22 to 25 in the most AI-exposed occupations, such as junior software developers and customer support staff, saw a 13% relative decline in employment, even after controlling for firm-level shocks. Crucially, those declines concentrated in roles where AI automates work rather than augments it, and a later update placed the clearest part of the decline in 2024.
Anthropic’s own data points the same direction more faintly. It found that hiring of young workers into exposed occupations fell about 14%, a result it called barely significant, with no similar effect for workers over 25. The Bureau of Labor Statistics link is also weak but present: every 10 percentage point rise in coverage came with a 0.6 percentage point drop in projected job growth through 2034. For added context, Anthropic’s own CEO has publicly warned that AI could eliminate a large share of entry-level white-collar jobs in the coming years, a far more aggressive view than the current data supports.
Siapa yang Paling Terdampak?
The profile of the exposed worker breaks the usual automation script. Comparing the most exposed quartile to the unexposed group before ChatGPT launched, Anthropic found the exposed group earned 47% more on average and was 16 percentage points more likely to be female.
Education stands out most. People with graduate degrees were 4.5% of the unexposed group but 17.4% of the most exposed group, almost a fourfold difference. This wave is reaching educated, higher-paid knowledge workers first, which is the opposite of how earlier automation hit factory and routine manual jobs.
Kesimpulan
Put all the statistics together and the message is balanced rather than alarming. AI’s theoretical reach into knowledge work is vast, often above 90% in fields like computing, finance, and administration. But real usage covers only a fraction of that, around a third even in the most affected category. The work AI does most is coding, customer service, and data entry. The work it barely touches is physical, manual, and care-based.
The employment picture is still mostly quiet. There is no broad unemployment spike tied to AI exposure, but there is a real and repeated signal among young entry-level workers, where both Stanford and Anthropic see hiring slow in automation-heavy roles. The split between augmentation and automation matters here, because jobs where AI assists people have held up while jobs where AI replaces tasks are where the early cracks appear.
For workers, the practical lesson is not to panic over an exposure score but to understand which side of that line your tasks fall on. For employers and policymakers, the data offers an early-warning system worth watching as it updates. The gap between what AI can do and what it is doing remains wide, and how fast that gap closes is the number that will matter most over the next few years.
Pertanyaan Umum Demo Slot
Computer Programmers lead with 75% task coverage, followed by Customer Service Representatives and Data Entry Keyers at 67%. Broader categories like Computer and Math, Business and Finance, and Office and Administrative roles also show some of the highest overall exposure.
Theoretical exposure measures what AI could handle, while observed exposure tracks what it is actually doing based on real usage data. Computer and Math roles, for example, are 94% theoretically exposed but only 33% covered in practice, showing adoption is still far behind potential.
Not necessarily — a high score means AI could speed up many of your tasks, not that your role will be eliminated. Most current AI usage is about augmentation, meaning AI assists workers rather than replacing them outright.
Both Stanford and Anthropic research show that hiring and employment for workers aged 22 to 25 in highly exposed roles has slowed noticeably, while older workers show no clear impact. This is likely because AI can replicate the routine, learn-on-the-job tasks that junior employees typically handle.
The evidence is mixed and still early — Anthropic found no broad unemployment rise among exposed workers overall, though Stanford identified a 13% relative employment drop among young entry-level workers in the most automation-heavy roles. The clearest effects so far are concentrated among early-career professionals, not the wider workforce.