Il marketing degli influencer ha completato la sua evoluzione da tattica di novità a componente fondamentale dell' moderno mix di marketingCiò che è iniziato come marchi che pagavano celebrità per pubblicare foto è diventato un Industria globale da 32.6 miliardi di dollari con parametri di riferimento ROI standardizzati, sofisticati strumenti di rilevamento delle frodi, un'economia dei creatori professionalizzata e una sottocategoria B2B in crescita che si espande del 47% all'anno. Il settore è cresciuto 19 volte dal 2016 — e la sua crescita non è ancora terminata.
I dati del 2026 raccontano una storia particolarmente avvincente su dove risiede effettivamente il ROI: non con le mega-celebrità, ma con i micro e nano-creatori che godono di un maggiore coinvolgimento, di una maggiore fiducia da parte del pubblico, di costi inferiori e di una migliore tassi di conversioneComprendere questa distinzione, e l'intero panorama dei dati che la circonda, è il fondamento di qualsiasi strategia di influencer marketing efficace nel 2026.
Dimensioni e crescita del settore: i numeri che definiscono la posta in gioco
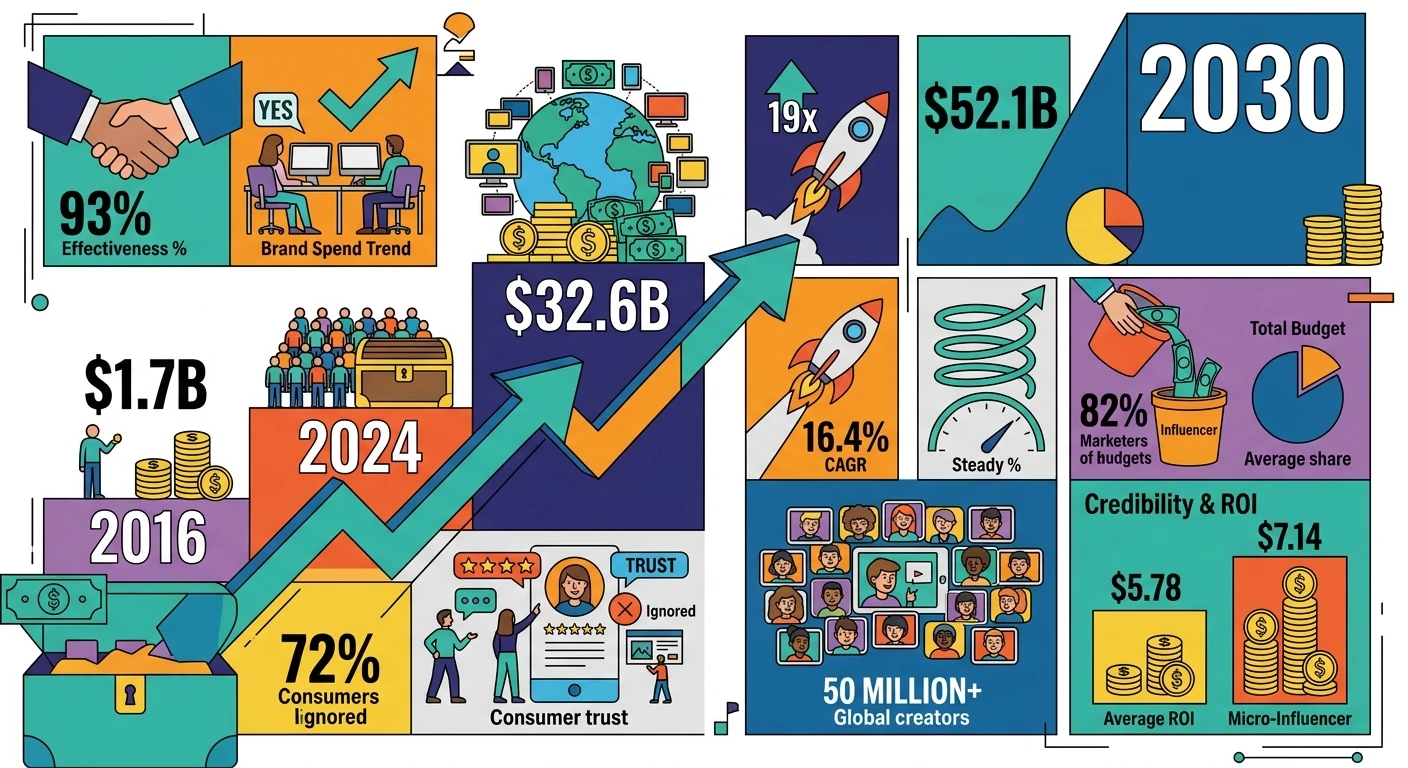
$32.6 miliardi — Dimensioni del mercato globale dell'influencer marketing nel 2026
19x Espansione del mercato dal 2016 (da 1.7 miliardi di dollari a 32.6 miliardi di dollari)
16.4% Tasso di crescita annuo composto (CAGR) dal 2021 al 2026
$52.1 miliardi — Dimensioni previste del settore entro il 2030
$24 miliardi — dimensioni del settore nel 2024 (crescita del 36% in soli due anni)
82% Oggi i marketer destinano un budget specifico al marketing degli influencer
17.4% — quota media del budget di marketing totale destinata alle campagne con influencer
63% dei marchi prevede di aumentare la spesa per gli influencer nel 2026
93% dei marketer che hanno utilizzato l'influencer marketing affermano che è efficace
72% dei consumatori si fidano di più delle raccomandazioni degli influencer rispetto alla pubblicità tradizionale del marchio
Più di 50 milioni creatori attivi a livello globale su tutte le piattaforme
La credibilità del settore è stata guadagnata attraverso risultati misurabili. Con un ritorno medio di 5.78 dollari per dollaro speso, l'influencer marketing offre uno dei ROI più alti in marketing digitale — e la differenza tra le categorie (i micro-influencer ottengono risultati migliori con 7.14 dollari per dollaro) sta creando una chiara direzione strategica per i marchi disposti ad analizzare i dati.
ROI e parametri di riferimento delle prestazioni
I dati sul ROI del marketing degli influencer sono ormai sufficientemente maturi da poter essere disaggregati per livello, piattaforma e categoria, rendendo possibile la creazione di modelli di budget precisi e basati su dati concreti.
ROI per livello di influencer:
Livello Influencer | Follower | ROI medio per ogni dollaro speso |
Nano-influencer | 1K – 10K | $6.52 |
Micro-influencer | 10K – 100K | $7.14 (il valore più alto) |
Influencer di medio livello | 100K – 500K | $5.18 |
Macro-influencer | 500K–1M | $4.23 |
Mega-influencer | 1+ | $3.42 |
Influencer di celebrità | 10+ | $2.87 (prezzo più basso) |
Ulteriori dati sul ritorno sull'investimento (ROI):
$5.78 rendimento medio su tutti i livelli e le piattaforme degli influencer
11x — Miglior ROI della campagna, riscontrato nelle categorie bellezza e fitness
2.18% tasso di conversione medio per il traffico generato dagli influencer
49% dei consumatori ha effettuato un acquisto basandosi sul consiglio di un influencer
8.7x più conveniente della pubblicità display in termini di CPM
37% più alto Tasso di fidelizzazione dei clienti acquisiti tramite influencer rispetto ad altri canali
61% Le campagne di maggior successo utilizzano strategie di ambasciatori sempre attivi (anziché campagne isolate).
Micro vs. Macro vs. Mega: il confronto completo
Il vantaggio in termini di tasso di coinvolgimento degli influencer più piccoli è ben consolidato, ma i dati del 2026 aggiungono dimensioni commerciali critiche: tassi di conversione, autenticità del pubblicoe punteggi di sicurezza del marchio, che rafforzano ulteriormente l'importanza dei micro e nano-influencer:
Metrico | Nano (1K–10K) | Micro (10K–100K) | Macro (500K–1M) | Mega (1M+) |
Tasso di coinvolgimento medio | 4.84% | 3.86% | 1.64% | 1.21% |
Costo medio per post | $ 50- $ 250 | $ 250- $ 1,250 | $ 5– $ 10 | $ 10–$ 50+ |
Tasso di conversione | 2.41% | 2.18% | 1.42% | 0.91% |
Costo per impegno | $0.14 | $0.18 | $0.82 | $1.67 |
ROI medio per $1 | $6.52 | $7.14 | $4.23 | $3.42 |
Autenticità del pubblico | 94.2% | 91.7% | 82.4% | 76.1% |
Punteggio di sicurezza del marchio | 91/100 | 88/100 | 79/100 | 72/100 |
I numeri parlano chiaro: i micro-influencer producono risultati Coinvolgimento 3.2 volte maggiore rispetto ai mega-influencer a Costo per post inferiore del 60%, Con Tasso di conversione 2.4 volte superioreInoltre, presentano punteggi significativamente più elevati in termini di autenticità del pubblico e sicurezza del marchio, aspetti importanti per la gestione del rischio, dato che i sistemi di rilevamento delle frodi diventano sempre più sofisticati.
Detto questo, i macro e mega-influencer svolgono funzioni specifiche che i creatori di contenuti più piccoli non possono sostituire:
84% dei principali lanci di prodotto utilizzano ancora macro/mega influencer per raggiungere il pubblico
I post dei mega-influencer raggiungono Portata 4.1 volte maggiore per post rispetto ai micro-influencer
Le campagne con i mega-influencer producono Riconoscimento del marchio superiore del 67%
92% dei marchi combinano micro e macro in strategie miste
I programmi di influencer marketing più efficaci nel 2026 sono di tipo ibrido: macro/mega per la notorietà e la memorizzazione del marchio, micro/nano per il coinvolgimento, la conversione e l'efficienza dei costi. Il 78% delle campagne di influencer marketing di successo coinvolgere i micro-influencer come componente fondamentale.
Prestazioni degli influencer piattaforma per piattaforma
La scelta della piattaforma è importante quanto la selezione del livello dell'influencer. I tassi di coinvolgimento, i costi e la durata dei contenuti variano significativamente a seconda della piattaforma:
Tassi di coinvolgimento degli influencer per piattaforma:
Piattaforma | Tasso medio di coinvolgimento degli influencer |
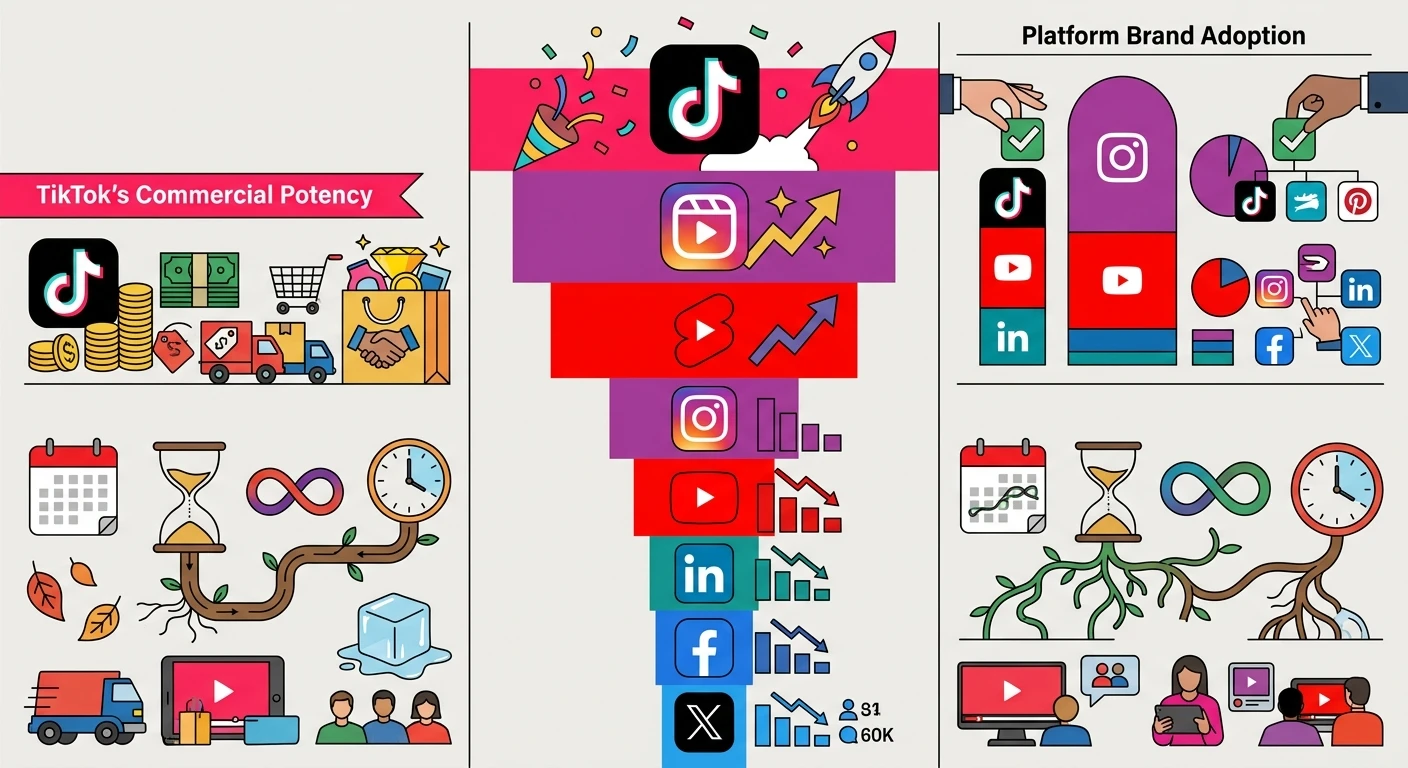
TikTok | 5.53% (il più alto) |
Instagram Reels | 3.74% |
YouTube Shorts | 3.21% |
Instagram feed | 1.84% |
Video di YouTube in formato lungo | 1.63% |
1.47% | |
0.82% | |
Twitter/X | 0.71% |
Adozione del marchio sulla piattaforma per le campagne con influencer: Instagram è leader a 67% Tasso di adozione, seguito da TikTok (56%) e YouTube (51%). LinkedIn è utilizzato solo dal 18% dei brand per le campagne con influencer, nonostante sia il canale di maggior valore per il B2B.
Il tasso medio di coinvolgimento degli influencer di TikTok, pari al 5.53% (il più alto di qualsiasi piattaforma), combinato con i suoi 33.1 miliardi di dollari di GMV di TikTok Shop, alimentati in gran parte dal commercio degli influencer, lo rende probabilmente il canale di influencer marketing commercialmente più potente attualmente disponibile. YouTube, nel frattempo, offre Durata di vita dei contenuti 2.7 volte maggiore rispetto alle piattaforme di formato breve: un aspetto significativo da considerare per il ROI delle campagne evergreen.
Parametri di riferimento per i prezzi dei creator (micro-influencer, da 10 a 100 follower)
Formato | Fascia di prezzo |
Bobina Instagram | $ 250- $ 1,250 |
Storia di Instagram | $ 100- $ 500 |
Video TikTok | $ 200- $ 1,000 |
Video su YouTube | $ 1,000- $ 5,000 |
Cortometraggio su YouTube | $ 200- $ 800 |
Post di LinkedIn | $ 500- $ 2,500 |
Articolo/Recensione del blog | $ 300- $ 1,500 |
Menzione nel podcast | $ 500- $ 3,000 |
Creatori con attribuzione delle vendite comprovata comandare un Sovrapprezzo di 2.1 volte rispetto a creatori di dimensioni equivalenti senza questo curriculum. Il passaggio a una remunerazione basata sulle prestazioni significa 73% di marchi si stanno orientando verso modelli di commissione/affiliazione che legano il pagamento a risultati misurabili, il che sta guidando una rapida espansione di guadagni da affiliazione e commissioni, ora rappresentando Il 34% del fatturato totale dei creatori e che cresce più rapidamente di qualsiasi altra fonte di reddito.
Marketing degli influencer B2B: la sottocategoria in più rapida crescita
Il marketing degli influencer B2B è il segmento più sottovalutato e in più rapida crescita del settore, espandendosi a 47% anno su anno con una spesa di 4.1 miliardi di dollari nel 2026.
11x ROI rispetto alla pubblicità digitale tradizionale per il SaaS aziendale
Ciclo di vendita più breve del 58% quando i potenziali clienti B2B sono esposti ai contenuti degli influencer
71% Gli acquirenti B2B sono influenzati dai leader di pensiero nelle loro decisioni di acquisto
Qualità del piombo 3.2 volte superiore dalle campagne di influencer marketing B2B rispetto ai social media a pagamento
43% Oggi i marchi B2B utilizzano la promozione da parte dei dipendenti come strategia di influenza
86% dei marketer B2B prevedono di aumentare i budget per gli influencer nei prossimi 12 mesi
Canali di influencer B2B per diffusione:
canale | Adozione del marchio |
78% | |
Twitter/X | 42% |
YouTube | 38% |
Podcast | 34% |
Blog del settore | 31% |
Webinar/eventi | 27% |
Sponsorizzazioni di newsletter | 24% |
Statistiche sulle frodi legate agli influencer: la tassa occulta sulle performance
Le frodi legate agli influencer – follower falsi, interazioni artificiali e metriche falsificate – rimangono una sfida significativa nonostante il miglioramento delle tecnologie di rilevamento:
$1.3 miliardi nelle perdite annuali stimate a livello globale dovute alle frodi degli influencer
14.2% degli account degli influencer mostrano segni di gonfiamento artificiale dei follower
22.8% l'interazione sui post sponsorizzati implica un'interazione non autentica
48% di marchi segnalano di essere stati colpiti da frodi legate agli influencer
I tassi di frode variano significativamente a seconda della piattaforma: X/Twitter (21.3%) and Facebook (19.1%) hanno i tassi di frode più elevati, mentre Linkedin (6.2%) and YouTube (9.7%) sono le piattaforme più pulite
L'impatto delle frodi sulle prestazioni della campagna elettorale:
47% inferiore Tasso di coinvolgimento reale per account con oltre il 20% di follower falsi
62% inferiore Tasso di conversione rispetto ad account autentici verificati
3.1x superiore costo per acquisizione per i marchi che collaborano con account fraudolenti
Nonostante questo, 94% di precisione Grazie agli strumenti di rilevamento delle frodi basati sull'intelligenza artificiale, il problema è gestibile per i marchi che investono nella verifica: Esposizione alle frodi inferiore del 67% per i marchi che utilizzano piattaforme di verifica di terze parti. 79% ormai molte aziende utilizzano strumenti di rilevamento delle frodi.
Prestazioni della campagna per settore
Industria | Media Fidanzamento | ROI medio per $1 | Crescita su base annua |
Bellezza e cosmetici | 3.87% | $8.21 | + 11% |
Salute e Fitness | 4.12% | $7.56 | + 18% |
Moda e abbigliamento | 3.21% | $6.84 | + 14% |
Servizi finanziari | 1.62% | $6.32 | + 38% |
Cibo e Bevande | 3.54% | $5.94 | + 16% |
Gaming | 4.47% | $5.83 | + 22% |
Tecnologia | 1.94% | $4.67 | + 31% |
Automotive | 2.14% | $4.91 | + 24% |
I servizi finanziari e la tecnologia presentano i tassi di coinvolgimento più bassi, ma sono tra i settori con la crescita più rapida in termini di adozione e offrono un elevato ritorno sull'investimento (ROI) poiché la dimensione media delle transazioni giustifica l'investimento. Il settore dei videogiochi ha il tasso di coinvolgimento più alto (4.47%) di qualsiasi altra categoria industriale.
DOMANDE FREQUENTI
Il ROI medio per l'influencer marketing nel 2026 è di 5.78 dollari per ogni dollaro speso, considerando tutte le piattaforme e i livelli di investimento. I micro-influencer sono in testa con 7.14 dollari per dollaro, mentre le campagne nel settore beauty e fitness, al loro apice, possono raggiungere un ritorno sull'investimento di 11 volte.
Sì, secondo la maggior parte dei principali indicatori di performance, i micro-influencer offrono un coinvolgimento 3.2 volte superiore, tassi di conversione 2.4 volte più alti e un ROI di 7.14 dollari rispetto ai 2.87 dollari degli influencer famosi. Detto questo, i mega-influencer offrono una portata 4.1 volte maggiore e una memorizzazione del marchio superiore del 67%, quindi le strategie miste tendono a essere le più efficaci.
TikTok è in testa a tutte le piattaforme con un tasso di coinvolgimento medio del 5.53% e 33.1 miliardi di dollari di GMV (Gross Merchandise Volume) su TikTok Shop, il che la rende la scelta migliore per il commercio dei creator. Instagram domina l'adozione da parte dei brand con il 67%, mentre YouTube offre la durata di vita dei contenuti più lunga, 2.7 volte superiore rispetto alle piattaforme di contenuti brevi, ideale per campagne evergreen.
Le frodi legate agli influencer costano al settore circa 1.3 miliardi di dollari all'anno, con il 22.8% delle attività sponsorizzate segnalate come non autentiche. L'utilizzo di strumenti di rilevamento delle frodi di terze parti riduce l'esposizione del 67%, e dare priorità a LinkedIn e YouTube, che presentano i tassi di frode più bassi rispettivamente del 6.2% e del 9.7%, aggiunge un ulteriore livello di protezione.
Sì, il marketing degli influencer B2B sta crescendo del 47% su base annua e offre un ROI 11 volte superiore rispetto alla pubblicità digitale tradizionale per le aziende SaaS. Inoltre, riduce i cicli di vendita del 58%, con LinkedIn come canale principale utilizzato dal 78% dei brand che gestiscono programmi di influencer marketing B2B.