Consumers face a clear choice in 2025 when selecting a smartphone: iPhone with its seamless iOS ecosystem or Android with diverse hardware options from brands like Samsung and Xiaomi.
iPhone users enjoy long-term software updates that keep devices secure for seven years, saving money on frequent replacements and ensuring smooth performance for daily tasks like banking or video calls.
Android users benefit from customizable interfaces and affordable models starting under $300, allowing budget-conscious families to equip everyone with capable phones for streaming or gaming without breaking the bank.
Businesses optimize apps knowing iPhone holds 58.03% US market share, prioritizing iOS for higher revenue per user—up to $142 billion in App Store spending—while Android’s 72.46% global dominance demands broad compatibility for maximum reach.
For instance, a freelancer edits photos on iPhone’s superior camera and A18 chip for 30% faster exports, whereas a student customizes an Android widget dashboard to track classes efficiently.
This guide on iPhone vs Android statistics 2025 empowers you with data to decide: parents select iPhone for family sharing safety, travelers choose Android for expandable storage on long trips, and developers target platforms where users spend most.
Over 3 billion active Android devices contrast 1+ billion iPhones, yet iOS leads in premium segments.
Merging global insights, iPhone vs Android statistics 2025 reveal trends through narratives and tables, helping you leverage strengths—iPhone for privacy-focused productivity or Android for versatile entertainment.
Global Market Share
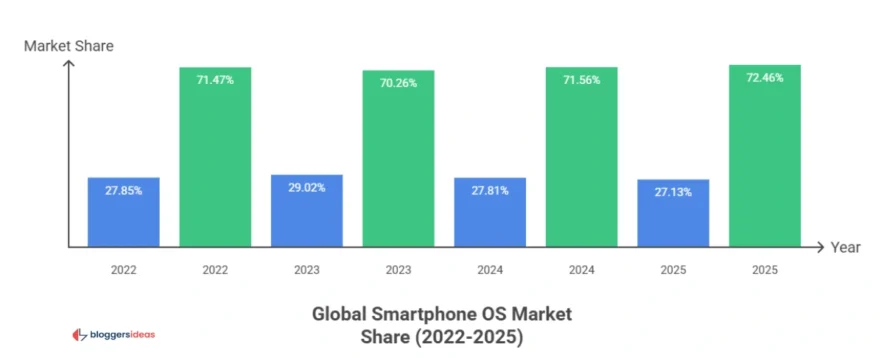
Android commands 72.46% worldwide smartphone OS share in July 2025, up slightly from 71.56% in 2024, powering budget to flagship devices across 190+ countries. iOS holds 27.13%, focusing on high-end consistency.
Android first surpassed 50% in 2014 at 53.65%, solidifying lead through variety.
Users in emerging markets choose Android for affordability—models like Redmi 14C enable internet access under $150—boosting education via free apps.
Developed regions favor iPhone for ecosystem integration; a professional syncs Mac, iPad, and iPhone for uninterrupted workflows, cutting task-switching time 25%.
The table tracks yearly shares from 2009 to 2025 (partial).
| Year | iPhone (iOS) (%) | Android (%) |
| 2009 | 34.01 | 2.41 |
| 2010 | 25.48 | 8.82 |
| 2011 | 22.29 | 19 |
| 2012 | 24.04 | 27.41 |
| 2013 | 24.03 | 39.21 |
| 2014 | 23.95 | 53.65 |
| 2015 | 20.2 | 64.2 |
| 2016 | 19.29 | 69.11 |
| 2017 | 19.65 | 72.63 |
| 2018 | 20.47 | 75.45 |
| 2019 | 22.71 | 75.47 |
| 2020 | 26.28 | 73.06 |
| 2021 | 27.34 | 71.89 |
| 2022 | 27.85 | 71.47 |
| 2023 | 29.02 | 70.26 |
| 2024 | 27.81 | 71.56 |
| 2025 | 27.13 | 72.46 |
Tablets show iOS at 50.68%, Android 49.12%—families buy iPads for durable kids’ modes.
Also read about: Apple Statistics
US Market Share: iPhone Leads Comfortably
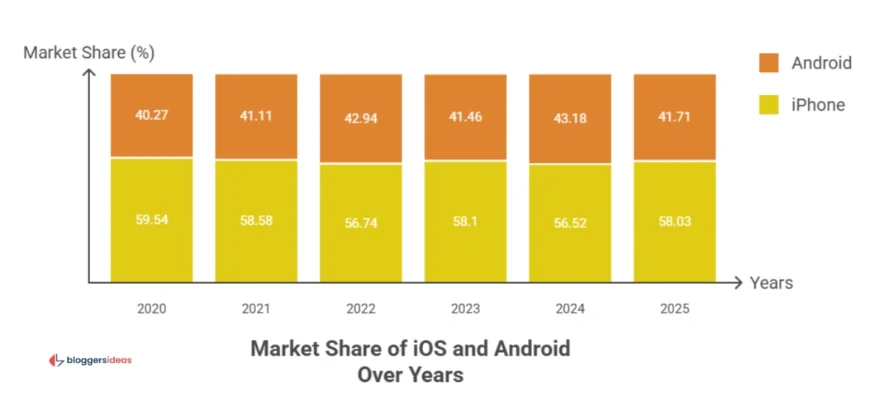
iOS captures 58.03% in the US by July 2025 versus Android’s 41.71%, driven by Gen Z loyalty—79% prefer Apple. Android peaked at 46.42% in 2015.
College students use iPhones for iMessage group chats and AirDrop sharing, fostering social connections. Businesses target iOS for 57.97% share, ensuring apps load faster on optimized hardware.
Yearly US data from 2009:
| Year | iPhone (iOS) (%) | Android (%) |
| 2009 | 57.9 | 6.16 |
| 2010 | 38.31 | 18.71 |
| 2011 | 38.33 | 35.32 |
| 2012 | 49.48 | 40.63 |
| 2013 | 52.79 | 39.25 |
| 2014 | 52.3 | 42.58 |
| 2015 | 50.85 | 46.42 |
| 2016 | 53.19 | 45.2 |
| 2017 | 53.89 | 45.23 |
| 2018 | 54.82 | 44.73 |
| 2019 | 55.23 | 44.51 |
| 2020 | 59.54 | 40.27 |
| 2021 | 58.58 | 41.11 |
| 2022 | 56.74 | 42.94 |
| 2023 | 58.1 | 41.46 |
| 2024 | 56.52 | 43.18 |
| 2025 | 58.03 | 41.71 |
Quarterly US from Q2 2023:
| Quarter | iOS (%) | Android (%) |
| Q2 2023 | 52 | 48 |
| Q3 2023 | 55 | 45 |
| Q4 2023 | 64 | 36 |
| Q1 2024 | 54 | 46 |
| Q2 2024 | 50 | 50 |
| Q3 2024 | 52 | 48 |
| Q4 2024 | 65 | 35 |
| Q1 2025 | 55 | 45 |
| Q2 2025 | 50 | 50 |
eSIM adoption hits 50% in North America via iPhone, simplifying carrier switches for travelers.
Also read about: Apple Music Users Statistics
Active Users and Device Install Base
Over 3 billion Android devices activate globally, versus 2.3+ billion Apple (including 1+ billion iPhones). US: 155 million iPhones (2024), ~133.4 million Android (2022), ~100 million Android early 2025.
Android suits global connectivity in rural areas with offline features. iPhone’s base ensures seven-year updates; users keep devices longer, reducing e-waste.
Smartphone Sales and Shipments
Q2 2025: Samsung ships 58 million Android units (19.7%), Apple 46.4 million iPhones (15.7%). 2024 annual: Apple 232.1 million, Samsung 223.4 million.
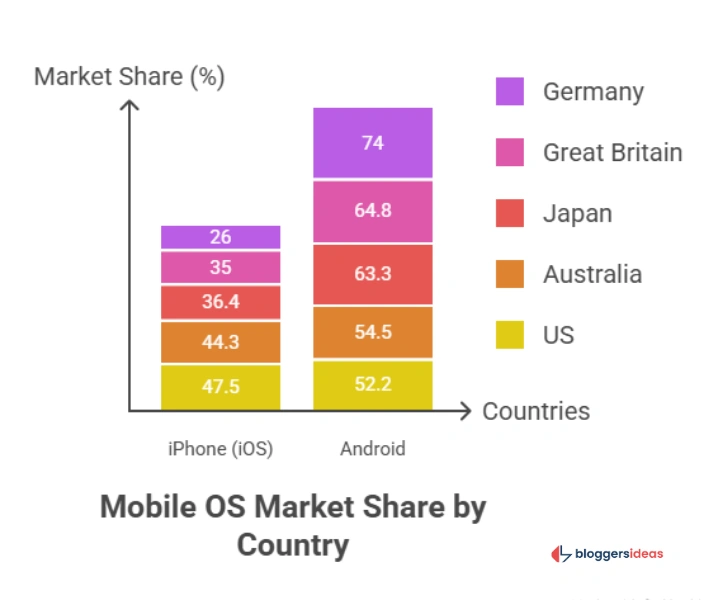
Q4 2023 sales: Android 56%, iPhone 37%. Select countries Q3 2024:
| Country | iPhone (iOS) (%) | Android (%) |
| US | 47.5 | 52.2 |
| Australia | 44.3 | 54.5 |
| Japan | 36.4 | 63.3 |
| Great Britain | 35 | 64.8 |
| Germany | 26 | 74 |
| Italy | 25.1 | 74.3 |
| France | 22.9 | 76.7 |
| China | 20.9 | 65.1 |
| Spain | 18.3 | 81 |
Top 10 best-sellers Q3 2024: 5 iPhones (16 series dominates), 5 Android (Galaxy A/S, Redmi).
Budget buyers grab Galaxy A15 for essentials; premium seekers choose iPhone 16 Pro Max for videography.
Average price: Android $293, iPhone $1,048 (projected $287/$1,015 by 2029).
Also read about: Android Usage Statistics
App Ecosystem: Availability, Downloads, Spending
Google Play: 1.68-2 million apps (96.95% free), App Store: 1.55-1.9 million (95.4% free).
2025 spending: App Store $142 billion, Google Play $65 billion (iOS 68.6%).
Yearly:
| Year | App Store (Billion USD) | Google Play (Billion USD) |
| 2021 | 85 | 47 |
| 2022 | 92 | 45 |
| 2023 | 108 | 51 |
| 2024 | 124 | 58 |
| 2025 | 142 | 65 |
| 2026 | 161 | 72 |
2024 IAP: $150 billion total. Downloads flat 136 billion, but 26 apps/month used.
February 2025 downloads: TikTok 65M Android, DeepSeek 21M iOS.
iPhone users spend $1.64/app vs. $0.43 Android; gamers (78% Android) but iOS revenue higher per user.
Developers monetize iOS subscriptions; Android focuses volume ads.
User Demographics: Age, Income, Gender, Loyalty
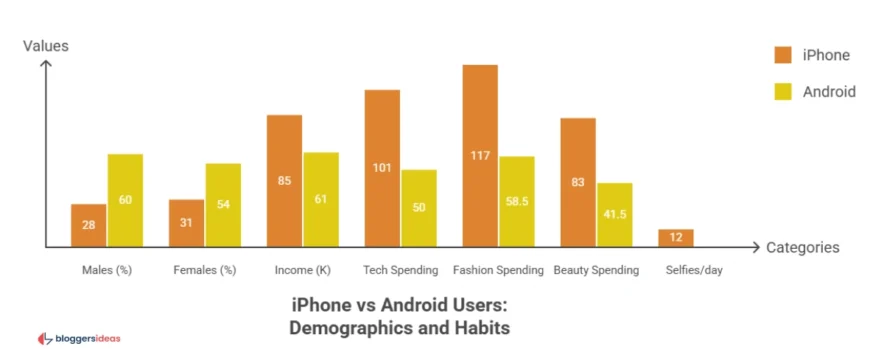
- Global: 60% males Android, 54% females; 31% females iPhone vs. 28% males.
- US Gen Z: 79% Apple, teens 88%. 25-34: 27% iPhone.
- iPhone income $85K vs. Android $61K; iPhone 27% graduate+.
- Loyalty: 90%+ iPhone upgrade to iPhone, Android 70-80%.
- iPhone: $101/month tech, $117 fashion, $83 beauty; Android half.
- 12 selfies/day iPhone vs. 7 Android.
- Young professionals build credit via Apple Card; families share Android storage.
Usage Habits and Behavior
- 5 hours/day iPhone, 3.7 Android. 75% messaging top activity.
- 62% price drives upgrades; 50% unwilling AI subs, 40%+ privacy concerns.
- Push CTR: Android 5.3%, iOS 2.75%.
- Dependency: 21% 18-29, 17% 65+.
- 78% mobile gamers Android.
- 52% Android would switch for functionality; 27.2% iPhone users disrespect Android vs. 16.7% reverse.
- 42% value Apple Intelligence.
- Satisfaction: Samsung 82, Apple 81.
- iPhone holds 2+ years (70%), Android <2 years (57%).
- iOS 18: 88% recent, 82% all. Android 14: 37.36%, 15: 3.32%.
Regional Insights: China, India, Others
China: Android 77.44%, iOS 21.81%. India: Android 96.67%, iOS 3.11%.
Android enables affordable 5G in India for online learning.
Latest from Quora and Reddit: Emerging Questions in 2025
Users query iPhone 17 foldable rumors versus Samsung Flip7 durability, Android 16 privacy dashboards beating iOS 19, and AI battery drain on Pixel 10 vs. iPhone 16.
Reddit debates eSIM-only iPhones forcing carrier locks, custom ROMs extending Android life to 10 years, and Vision Pro integration with Android AR glasses.
Quora explores cross-platform messaging mandates, quantum-resistant encryption in iOS 20 betas, and sustainable sourcing—Apple’s 100% recycled rare earths versus Android supply chains.
Enthusiasts root Android for ad-blocking, saving data 40%.
Future Trends and Practical Benefits
Global traffic 139 exabytes/month 2025, doubling by 2030. iPhone loyalty grows with Gen Z; Android innovates foldables.
Choose iPhone for ecosystem savings (trade-ins $500+), Android for flexibility (SD cards 1TB).
FAQs About iPhone vs Android Statistics
1. How do global market share differences in iPhone vs Android statistics 2025 help travelers choose a device?
iPhone’s reliable updates aid navigation, while Android’s dominance offers more carrier options and affordable SIM choices in emerging regions.
2. What spending habits from iPhone vs Android statistics 2025 benefit app developers targeting revenue?
iOS users spend $142 billion, favoring premium apps, while Android users contribute $65 billion, guiding developers to prioritize in-app purchases.
3. Why does user loyalty in iPhone vs Android statistics 2025 matter for families planning upgrades?
90% of iPhone users stay within the ecosystem for smooth upgrades and data sharing, while Android offers more budget variety, appealing to mixed-brand families.
4. How can privacy concerns highlighted in iPhone vs Android statistics 2025 influence business security choices?
Businesses prefer iPhones for secure, on-device data handling and longer updates, while Android’s customizable permissions offer cost-effective security options.
5. What demographic insights from iPhone vs Android statistics 2025 guide educators selecting student devices?
Gen Z prefers iPhones for seamless collaboration, while Android offers budget-friendly options with expandable storage for education-focused apps.
Also Read:
- Android Usage Statistics
- Coupon Statistics
- Email Marketing Statistics
- Online Advertising Statistics
- Podcast Statistics
Conclusion:
iPhone vs Android statistics 2025 highlight Android’s 72.46% global volume versus iPhone’s premium 58.03% US lead and $142 billion spending—guiding consumers to iOS for longevity/privacy or Android for affordability/customization, maximizing daily efficiency and value.
Source: Statista, Exploding Topics