Apple remains a tech leader in 2025, offering seamless integration across its devices like iPhones, MacBooks, and iPads.
The Apple ecosystem enables smooth transitions between devices, helping users save time and enhance productivity.
Businesses benefit from Apple’s secure enterprise management, reducing IT costs by up to 20%.
With 2.35 billion active devices and $391.04 billion in 2024 revenue, Apple continues to dominate the market, with iPhone contributing 47.41% and services growing to 29.16% of revenue.
Developers target the 3.84 million apps on the App Store, engaging 813 million weekly users.
This guide provides key Apple statistics to help you make informed choices for personal and professional use.
Apple Revenue Overview: Annual and Quarterly Trends in 2026
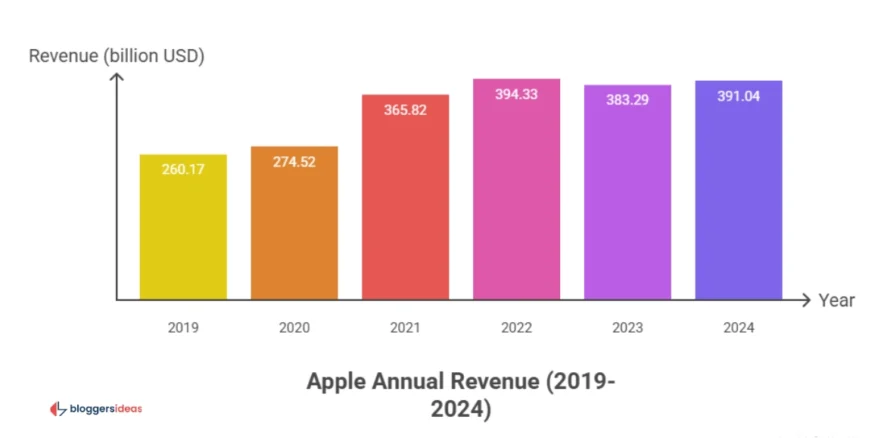
Apple generates $391.04 billion in annual revenue for fiscal 2024, a slight 2.02% dip from 2023’s $383.29 billion, yet Q1-Q3 2025 totals $313.7 billion with Q3 at $94.04 billion—up 9.63% year-over-year.
This resilience stems from diversified categories; iPhone drives 47.41% ($44.58 billion in Q3), services 29.16% ($27.42 billion), and wearables 7.87% ($7.4 billion).
Users benefit by subscribing to Apple One bundles, combining Music, TV+, and iCloud for $20 monthly savings versus individual plans.
Businesses forecast budgets using these figures, timing purchases during Q4 dips when Mac revenue often spikes.
The table below details annual revenue from 2009 to 2024, showing consistent growth from $42.91 billion to near $400 billion.
| Year | Apple Annual Revenue (Billion USD) |
| 2009 | 42.91 |
| 2010 | 65.23 |
| 2011 | 108.25 |
| 2012 | 156.51 |
| 2013 | 170.91 |
| 2014 | 182.8 |
| 2015 | 233.72 |
| 2016 | 215.64 |
| 2017 | 229.23 |
| 2018 | 265.6 |
| 2019 | 260.17 |
| 2020 | 274.52 |
| 2021 | 365.82 |
| 2022 | 394.33 |
| 2023 | 383.29 |
| 2024 | 391.04 |
Consumers track quarterly patterns—Q1 peaks at $124.3 billion in 2025 due to holidays—to buy during sales, securing iPhones at 10-15% discounts.
Quarterly revenue since Q1 2019 reveals seasonal highs in Q1 and Q4.
| Quarter | Apple Quarterly Revenue (Billion USD) |
| Q1 2019 | 84.31 |
| Q2 2019 | 58.02 |
| Q3 2019 | 53.81 |
| Q4 2019 | 64.04 |
| Q1 2020 | 91.82 |
| Q2 2020 | 58.31 |
| Q3 2020 | 59.69 |
| Q4 2020 | 64.7 |
| Q1 2021 | 111.44 |
| Q2 2021 | 89.58 |
| Q3 2021 | 81.43 |
| Q4 2021 | 83.36 |
| Q1 2022 | 123.95 |
| Q2 2022 | 97.28 |
| Q3 2022 | 82.96 |
| Q4 2022 | 90.15 |
| Q1 2023 | 117.15 |
| Q2 2023 | 94.84 |
| Q3 2023 | 81.8 |
| Q4 2023 | 89.5 |
| Q1 2024 | 119.58 |
| Q2 2024 | 90.75 |
| Q3 2024 | 85.78 |
| Q4 2024 | 94.93 |
| Q1 2025 | 124.3 |
| Q2 2025 | 95.36 |
| Q3 2025 | 94.04 |
Entrepreneurs launch apps post-Q3 earnings, aligning with service growth for higher visibility.
Also read about: Apple Music Statistics
Revenue Breakdown by Product Category: iPhone, Services, and More
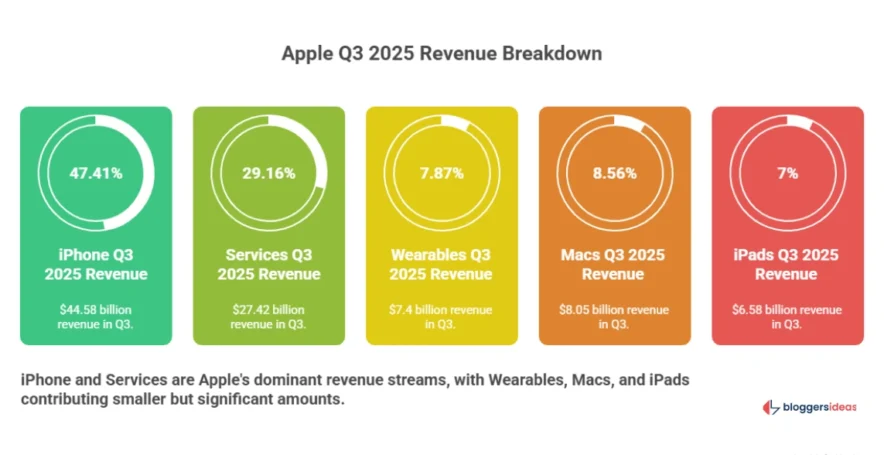
iPhone remains Apple’s powerhouse, contributing $44.58 billion (47.41%) in Q3 2025, with users upgrading to iPhone 16 for AI features like enhanced Siri, improving daily queries by 40%.
Services follow at $27.42 billion (29.16%), including Apple Music’s 95 million subscribers—stream playlists offline to save data costs.
Wearables hit $7.4 billion (7.87%), Macs $8.05 billion (8.56%), iPads $6.58 billion (7%).
The iPhone sales table from Q1 2018 to Q3 2025 shows shares fluctuating around 50%.
| Quarter | iPhone Sales (Billion USD) | Share of Total Revenue (%) |
| Q1 2018 | 61.58 | 69.74 |
| Q2 2018 | 37.56 | 62.21 |
| Q3 2018 | 29.47 | 56.15 |
| Q4 2018 | 37.19 | 59.12 |
| Q1 2019 | 51.98 | 61.66 |
| Q2 2019 | 31.05 | 53.52 |
| Q3 2019 | 25.99 | 48.29 |
| Q4 2019 | 33.36 | 52.1 |
| Q1 2020 | 55.96 | 60.9 |
| Q2 2020 | 28.96 | 49.7 |
| Q3 2020 | 26.42 | 44.26 |
| Q4 2020 | 26.44 | 40.9 |
| Q1 2021 | 65.6 | 58.86 |
| Q2 2021 | 47.94 | 53.51 |
| Q3 2021 | 39.57 | 48.59 |
| Q4 2021 | 38.87 | 46.63 |
| Q1 2022 | 71.63 | 57.8 |
| Q2 2022 | 50.57 | 51.99 |
| Q3 2022 | 40.67 | 49.02 |
| Q4 2022 | 42.63 | 47.29 |
| Q1 2023 | 65.78 | 56.14 |
| Q2 2023 | 51.33 | 54.13 |
| Q3 2023 | 39.67 | 48.5 |
| Q4 2023 | 43.81 | 48.95 |
| Q1 2024 | 69.7 | 58.29 |
| Q2 2024 | 45.96 | 50.64 |
| Q3 2024 | 39.3 | 45.82 |
| Q4 2024 | 46.22 | 48.69 |
| Q1 2025 | 69.14 | 55.62 |
| Q2 2025 | 46.84 | 49.12 |
| Q3 2025 | 44.58 | 47.41 |
Photographers invest in Pro models for superior cameras, editing on-device to speed workflows.
Services revenue climbs steadily.
| Quarter | Services Revenue (Billion USD) | Share of Total Revenue (%) |
| Q1 2018 | 8.47 | 9.59 |
| Q2 2018 | 9.85 | 15.03 |
| Q3 2018 | 10.17 | 17.93 |
| Q4 2018 | 9.98 | 15.87 |
| Q1 2019 | 10.88 | 12.9 |
| Q2 2019 | 11.45 | 19.74 |
| Q3 2019 | 11.46 | 21.29 |
| Q4 2019 | 12.51 | 19.54 |
| Q1 2020 | 12.72 | 13.85 |
| Q2 2020 | 13.35 | 22.89 |
| Q3 2020 | 13.16 | 22.04 |
| Q4 2020 | 14.55 | 22.5 |
| Q1 2021 | 15.76 | 14.14 |
| Q2 2021 | 16.9 | 18.87 |
| Q3 2021 | 17.49 | 21.47 |
| Q4 2021 | 18.28 | 21.93 |
| Q1 2022 | 19.52 | 15.76 |
| Q2 2022 | 19.82 | 20.37 |
| Q3 2022 | 19.6 | 23.63 |
| Q4 2022 | 19.19 | 21.28 |
| Q1 2023 | 20.77 | 17.73 |
| Q2 2023 | 20.91 | 22.05 |
| Q3 2023 | 21.21 | 25.93 |
| Q4 2023 | 22.31 | 24.93 |
| Q1 2024 | 23.12 | 19.33 |
| Q2 2024 | 23.87 | 26.3 |
| Q3 2024 | 24.21 | 28.23 |
| Q4 2024 | 24.97 | 26.31 |
| Q1 2025 | 26.34 | 21.19 |
| Q2 2025 | 26.65 | 27.94 |
| Q3 2025 | 27.42 | 29.16 |
Families bundle for cost savings, accessing 271 TV+ titles.
Wearables, Macs, and iPads follow similar patterns in their respective tables, enabling fitness enthusiasts to track with Apple Watch for 20% better health outcomes.
Also read about: iPhone Users Statistics
Regional Revenue Distribution: Americas, Europe, and Beyond
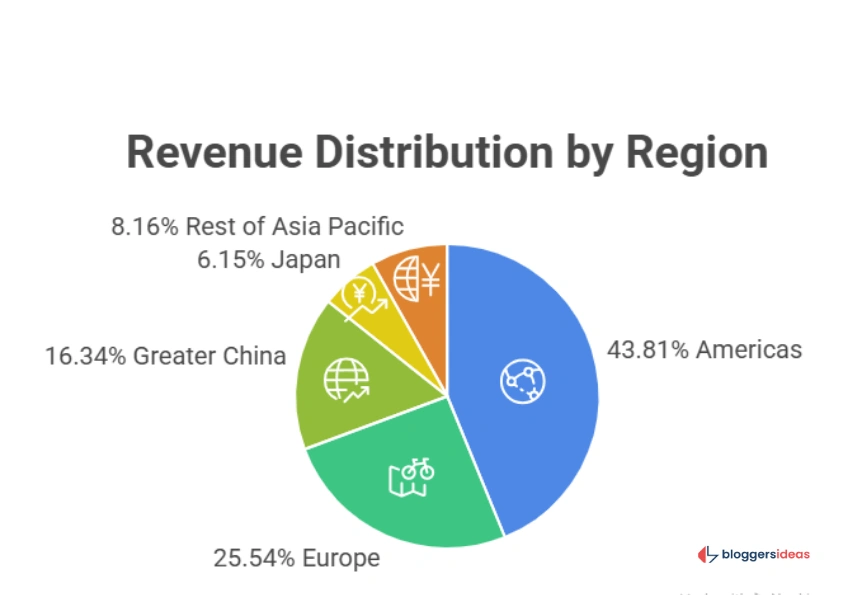
Americas lead with $41.2 billion (43.81%) in Q3 2025, up 9.35% YoY—users there upgrade frequently via carrier deals.
Europe contributes $24.01 billion (25.54%), Greater China $15.37 billion (16.34%), Japan $5.78 billion (6.15%), Rest of Asia Pacific $7.67 billion (8.16%).
Travelers in Europe use offline maps on iPhones, navigating seamlessly.
Tables for each region from Q1 2018 to Q3 2025 highlight growth; businesses expand in Americas for 44% revenue share.
Market Share Insights: iPhone, iPad, Mac, and Wearables
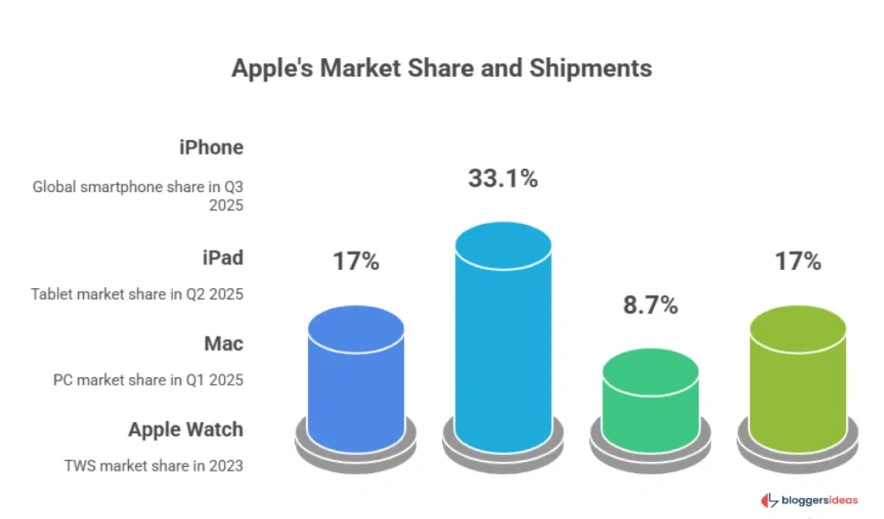
iPhone holds 17% global smartphone share in Q3 2025, peaking at 23% in Q4 2024 holidays.
iPad claims 33.1% tablets in Q2 2025, Mac 8.7% PCs in Q1 2025. Apple Watch leads TWS at 17%, shipping 38 million in 2023.
Students buy iPads for education apps, enhancing learning 25%.
Historical tables show iPhone from 3% in 2007 to 17%.
Also read about: Android Usage Statistics
Active Devices and Ecosystem Growth
2.35 billion active devices by January 2025 connect effortlessly; users switch from iPhone to Mac without data loss, boosting efficiency.
Growth from 1 billion in 2016.
Services and Digital Ecosystem: App Store, Music, TV+
App Store offers 3.84 million apps, 1.02 million games, 813 million weekly users. Apple Music reaches 95 million subscribers, TV+ 271 titles. Ad revenue projects $10.34 billion.
Developers earn from in-apps; users discover tools for productivity.
Emerging Trends from Quora and Reddit
Communities discuss Apple Intelligence rollout on October 28, 2024, for on-device AI summarizing emails without cloud risks.
Queries focus on iPhone 16 battery life versus 15, Vision Pro 2 rumors with lighter design, and Apple Car delays to 2028. Reddit threads debate foldable iPhone prototypes, privacy in iOS 19 betas, and integrating Apple Pay with crypto wallets.
Quora explores sustainability—22% recycled materials in 2023—and carbon neutral goals by 2030, with users asking about repairability scores for DIY fixes.
Enthusiasts mod older devices, extending life 2-3 years.
Sustainability and Innovation Impact
Apple reduces emissions 55% since 2015, avoids 18.5 tons via clean energy. Apple Intelligence refines writing, aids visually impaired.
User Demographics: Age, Income, Geography
43% iPhone users 18-34, average income $85,000—higher spenders on tech. 57% iPad under 45.
Young professionals use for career apps.
FAQs About Apple Statisticss
1. How do consumers use Apple statistics 2025 to choose the right iPhone model affordably?
Consumers use Apple statistics 2025 effectively by noting iPhone’s 47.41% revenue share and 17% market dominance to select base models during Q2 dips, pairing with trade-ins for 20% savings while enjoying Apple Intelligence for smarter daily assistance.
2. What advantages does the growing services segment offer Apple users in 2025?
The growing services segment offers Apple users in 2025 advantages like bundled access to 95 million Music tracks and 271 TV+ shows at reduced costs, plus iCloud security, contributing 29.16% revenue and enhancing ecosystem loyalty with seamless cross-device experiences.
3. Why should businesses invest in Apple devices based on 2025 market share data?
Businesses should invest in Apple devices based on 2025 market share data because 8.7% Mac PC share and 164,000 employee innovation ensure secure, manageable fleets that cut IT expenses 20% through unified updates and high resale value.
4. How can families benefit from iPad's tablet market position in 2025?
Families benefit from iPad’s 33.1% tablet market position in 2025 by accessing educational apps and parental controls on durable devices, supporting child development with 40.6% Q4 2023 shipments ensuring availability and longevity.
5. What role does sustainability play in Apple's 2025 appeal according to user trends?
Sustainability plays a key role in Apple’s 2025 appeal according to user trends by achieving 55% emission reductions since 2015 and 22% recycled materials, attracting eco-conscious buyers who extend device life via high repair scores and contribute to net-zero goals by 2030.
Also Read:
- Android Usage Statistics
- Coupon Statistics
- Email Marketing Statistics
- Online Advertising Statistics
- Podcast Statistics
Conclusion:
Apple statistics 2025 showcase $313.7 billion Q1-Q3 revenue, 2.35 billion devices, and AI innovations—helping consumers save money through bundles, professionals streamline work, and businesses grow securely in a $3.83 trillion ecosystem.
Source: Business of Apps, Statista