In the dynamic digital landscape of 2025, Conversion Rate Optimization (CRO) has solidified its position as a paramount strategy for businesses aiming to maximize their online presence and achieve sustainable growth.
As competition intensifies across all sectors, understanding and actively implementing CRO has become not just beneficial, but essential.
This comprehensive article delves into the latest CRO statistics for 2025, offering a detailed look at conversion rates across various industries, key trends, adoption rates, and the significant return on investment that businesses are realizing through dedicated CRO efforts.
We will explore how businesses are leveraging CRO to convert more visitors into valuable customers and how you can apply these insights for your own benefit, incorporating the freshest discussions from online forums to provide a holistic view.
The Indispensable Role of CRO in 2026: A Top Business Priority
- The current digital economy places an unprecedented emphasis on efficiency and effectiveness, making CRO a top priority for businesses of all sizes.
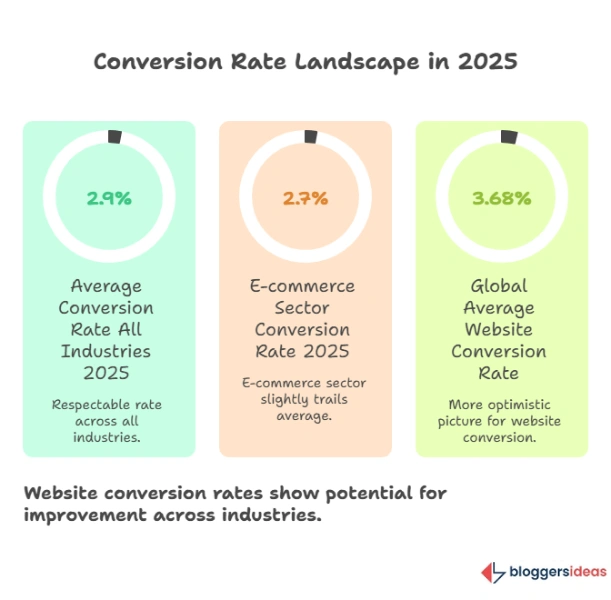
- In 2025, the average conversion rate across all industries stands at a respectable 2.9%, with the e-commerce sector slightly trailing at 2.7%.
- However, the global average website conversion rate paints a more optimistic picture, hovering around 3.68%.
- These figures underscore the vast potential for improvement and the critical need for optimization strategies.
- Businesses are increasingly recognizing that simply driving traffic is insufficient; converting that traffic into tangible outcomes—whether sales, leads, or sign-ups—is where true value lies.
- The investment landscape for CRO reflects its growing importance.
- Many businesses are now allocating a significant portion of their marketing budget, sometimes as much as 30%, directly towards CRO initiatives.
- This substantial investment is yielding impressive returns, with companies utilizing CRO tools reporting an average ROI of 223%.
- This compelling return on investment is a powerful testament to the effectiveness of systematic optimization efforts.
- Moreover, the global market for CRO software is projected to experience robust growth, from an estimated $771 million in 2018 to a staggering $1,932 million by 2026, with a compound annual growth rate (CAGR) of 10%.
- This upward trend signifies a strong and sustained commitment from the business community towards leveraging CRO technologies.
Source: Statista.
Key CRO Statistics for 2026: A Snapshot of the Current Landscape
Understanding the core statistics provides a foundational insight into the current state of CRO. Here are some of the most critical figures shaping the optimization landscape in 2025:
- The average conversion rate across all industries is 2.9%.
- E-commerce platforms typically experience an average conversion rate of 2.7%.
- The global average website conversion rate reaches 3.68%.
- Paid search campaigns generally achieve a conversion rate of 3.2%.
- CRO can constitute approximately 30% of a company’s overall marketing budget.
- Companies that actively employ CRO tools witness an impressive average ROI of 223%.
- On average, businesses invest nearly $2,000 per month specifically on CRO tools.
- The global CRO software market is projected to reach $5.07 billion by 2025, reflecting significant anticipated growth and adoption.
These statistics collectively illustrate a robust and expanding commitment to CRO, driven by its demonstrable impact on business performance and revenue generation.
General CRO Statistics: Understanding Challenges and Responsibilities
- While the benefits of CRO are clear, its implementation often comes with its own set of challenges and organizational complexities.
- A notable finding reveals that 40% of companies lack a designated individual or team specifically accountable for conversion rate optimization.
- This organizational ambiguity can impede effective strategy development and execution.
- Conversely, 30% of respondents indicate that a dedicated team manages optimization efforts, while 29% rely on a single, committed person.
- This varied approach highlights the ongoing evolution of CRO roles within organizations.
- One of the most significant hurdles marketers face is converting generated leads into sales, with a striking 79% of leads failing to convert.
- Furthermore, 56% of generated leads are not yet prepared to make a purchase, emphasizing the need for nurturing strategies alongside conversion efforts.
- The customer experience plays a crucial role in conversion; 63% of shoppers are more inclined to buy online from a business if they have had a positive in-store purchase experience.
- This statistic underscores the importance of a seamless, omnichannel customer journey.
- Marketers frequently cite finding convertible leads as one of their biggest challenges in lead generation, with 55% reporting this difficulty.
- The technical aspects of CRO also present a learning curve; 82% of marketers admit that mastering how to effectively track and test conversion rates is either highly or moderately challenging.
- Post-COVID-19, two primary challenges in CRO have emerged: securing buy-in from key decision-makers and establishing more efficient processes.
- These insights reveal that successful CRO implementation requires not only technical expertise but also strong internal advocacy and streamlined operational frameworks.
Bounce Rate Statistics: Minimizing Departures and Maximizing Engagement
Bounce rate, which measures the percentage of visitors who leave a website after viewing only one page, directly impacts conversion rates. A high bounce rate often signals issues with user experience, relevance, or site performance.
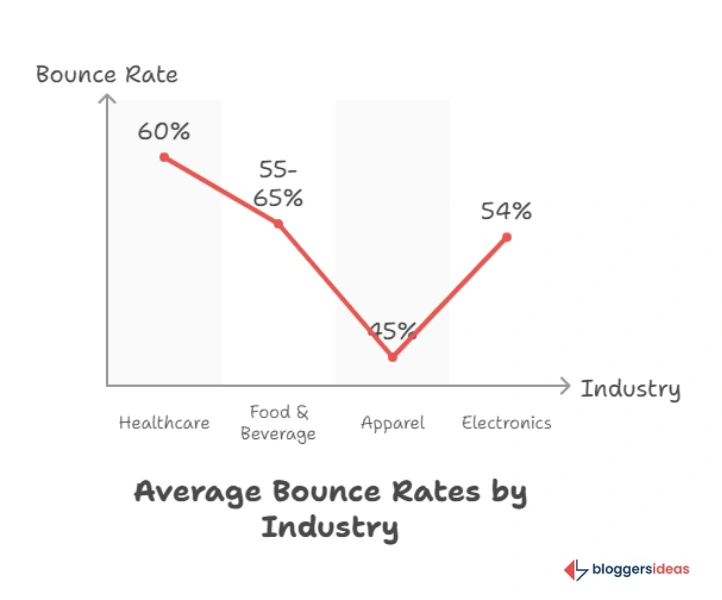
Across all sectors, the average bounce rate typically falls between 26% and 70%. Mobile devices exhibit the highest bounce rate at 51%, a critical consideration given the increasing prevalence of mobile browsing. Even in popular niches like the apparel industry, the average bounce rate stands at 45%.
Here is a table detailing the average bounce rate across different sectors:
| Sector | Average Bounce Rate |
| Food & Beverage | 55% to 65% |
| Healthcare | 60% |
| Apparel | 45% |
| Electronics | 54% |
| Financial Services | 50% |
| SaaS (Software as a Service) | 65% |
Website loading speed plays a crucial role in mitigating bounce rates. A mere 1-3 second web page load time can increase the probability of a bounce by 32%.
This probability escalates significantly with longer load times: a 1-6 second delay increases the bounce rate probability by 90%, and a 1-10 second delay boosts it by a staggering 123%.
These statistics strongly emphasize the necessity of optimizing website performance to retain visitors and encourage further engagement.
CRO Adoption Statistics: Embracing Optimization Across Industries
- The benefits of CRO are compelling, driving a growing number of businesses to adopt optimization strategies.
- While 69% of firms have adopted tools and techniques for increasing conversion rates and measuring experiences, this figure also indicates that a substantial portion of companies has yet to fully embrace CRO.
- Notably, 68% of small businesses have not yet implemented CRO strategies, highlighting a significant untapped potential in this segment.
- Experience testing stands out as the most widely used content optimization tool by firms, with 64% of marketers employing UX testing for CRO.
- Personalization is utilized by 61% of marketers, while 57% prefer content testing as part of their CRO techniques.
- Despite these adoption rates, 53% of companies allocate less than 5% of their marketing budget to optimization activities, suggesting that even among adopters, the investment level can vary greatly.
- On average, companies are spending around $2,000 per month on CRO tools.
- However, only 39.6% of companies globally document their CRO strategy, which can lead to inconsistencies and make it harder to track progress and refine efforts.
- A striking statistic reveals that less than 0.11% of online websites actually use CRO tools or run tests to optimize conversion rates, indicating a massive opportunity for businesses willing to invest in and formalize their optimization efforts.
- This low adoption rate amongst general websites, coupled with high returns for those who do, paints a clear picture of competitive advantage for early adopters.
Marketers’ Investment in CRO: Budgeting for Better Conversions
- The financial commitment to CRO reflects its perceived value and impact.
- Marketers can allocate as much as 30% of their overall marketing budget to CRO.
- The cost of CRO tools, which are essential for managing conversion rates and optimization, varies significantly, ranging from $10 to $500 per month.
- On average, companies invest approximately $2,000 per month on these tools.
- For businesses that opt for external expertise, engaging a CRO service agency can incur an average monthly cost between $800 and $10,000.
- Large companies, in particular, often spend an average of $2,000 monthly on CRO tools and services, emphasizing the scale of investment required for comprehensive optimization.
- The global market for CRO software is experiencing robust growth, with predictions of a 10% CAGR.
- From an estimated $771 million in 2018, the market is expected to surge to $1,932 million by 2026.
- This growth is underpinned by the compelling ROI generated by CRO efforts.
- Companies utilizing CRO tools achieve an impressive average ROI of 223%.
- A survey conducted by Venture Beats highlighted an even more extraordinary outcome, with 173 marketers reporting returns exceeding 1,000% after implementing CRO tools.
- While 5% of participants in the same study did not even generate the average ROI of 223%, this variability underscores the importance of strategic implementation and continuous refinement in CRO efforts.
Average Conversion Rate: Benchmarks Across the Digital Spectrum
Understanding what constitutes a “good” conversion rate is crucial for setting realistic goals and evaluating performance. An average website conversion rate typically falls between 2% and 5%. Websites achieving conversion rates above 5% are generally considered to be performing well or above average.
The top 25% of websites boast conversion rates of 5.31% or higher, while the top 10% demonstrate even more impressive figures, with conversion rates nearing 12% or higher for their landing pages. The best-performing websites consistently achieve an average conversion rate of 11%.
Device type also influences conversion rates. Desktops record the highest conversion rate at 14%, significantly outperforming tablets at 3.36% and smartphones at 1.53%. This disparity highlights the need for mobile-first optimization strategies to improve conversion rates on smaller screens.
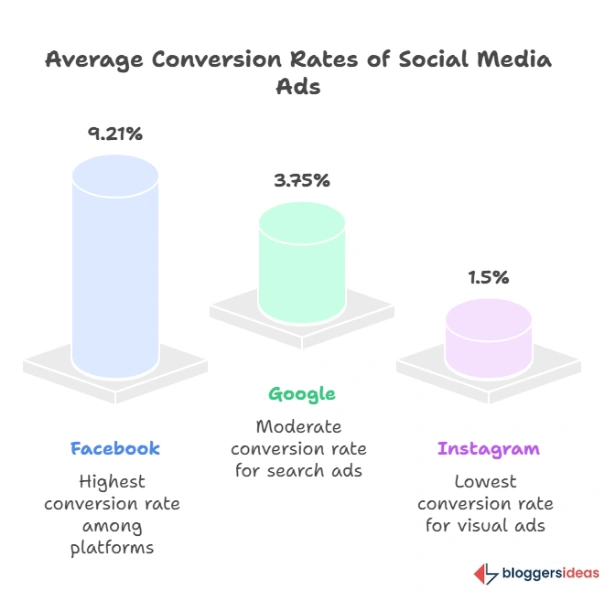
Paid advertising platforms also exhibit varying conversion rates:
- Facebook ads have an average conversion rate of 9.21%.
- Google ads show an average conversion rate of 3.75%.
- Instagram ads typically yield a conversion rate of 1.5%.
For B2B marketers, the conversion rate is a vital metric for assessing landing page performance, with 75% considering it highly important.
The average conversion rate for paid searches stands at 3.2%. Among industries, financial services record the highest paid search conversion rates, averaging an impressive 15.6%.
Conversely, B2B services register the lowest paid conversion rates at 0.9%, followed by the B2B tech industry (1.5%), B2B e-commerce industry (1.7%), and the travel and healthcare industries (both at 1.7% and 1.9% respectively).
Inbound marketing strategies can significantly boost conversion rates for an average website, potentially increasing them by 6% to 12%, reinforcing the value of content-driven approaches.
Average Conversion Rates by Industry: Sector-Specific Insights
Conversion rates vary significantly across different industries, influenced by factors such as business model, pricing, target audience, marketing strategies, and product types. Understanding these industry-specific benchmarks is essential for effective CRO.
Here are detailed conversion rates recorded across various industries:
| Industry | Conversion Rate Range |
| E-commerce | 1.84% to 3.71% |
| B2B | 2.23% to 4.31% |
| Legal | 1.07% |
| Finance | 5.01% to 15% |
| Automotive | 2.5% |
| B2B E-commerce | 4.0% |
| B2B Services | 7.0% |
Within the e-commerce sector, the arts and crafts market boasts the highest conversion rate at 3.79%. Other e-commerce market conversion rates include:
| Market | Conversion Rate |
| Arts and crafts | 3.79% |
| Health and well-being | 3.62% |
| Pet care | 3.28% |
| Fashion clothing and accessories | 2.44% |
| Food and drink | 2.37% |
| Electrical and commercial equipment | 2.23% |
| Home accessories and giftware | 2.16% |
The average e-commerce conversion rate hovers around 2.5% to 3%. More specifically, the fashion, accessories, and apparel sector sees a conversion rate of 3.2%, while the health and wellbeing market averages 2.8%.
The luxury kitchen and home appliances market, however, experiences a lower average conversion rate of 0.8%, highlighting the impact of product type and price point on conversion.
Email Conversion Rates: Optimizing the Inbox for Action
Email marketing remains a powerful tool for driving conversions, despite the sheer volume of digital communication. With 361 billion emails sent daily worldwide, only 3.61 billion are converted, underscoring the challenge of standing out.
The average conversion rate for email marketing is an encouraging 17.75%. When considering click-through rates, the average conversion rate for email marketing campaigns stands at 15.22%.
Personalization significantly impacts email engagement; emails with personalized subject lines are 22% more likely to be opened.
Interestingly, emails without a subject line sometimes achieve an 8% higher open rate than those with a subject line, suggesting that intrigue or a perceived urgency can sometimes override explicit messaging.
Cart recovery emails are particularly effective, with 8.24% leading to conversions, emphasizing their critical role in recouping lost sales.
Landing Page Conversion Statistics: Crafting Effective Destinations
Landing pages are crucial conversion points, specifically designed to elicit a desired action. A successful landing page typically aims for a conversion rate between 2% and 5%. However, top-performing landing pages can achieve significantly higher average conversion rates.
- 57% of B2B marketers identify conversion rate as the most useful metric for analyzing a landing page’s performance.
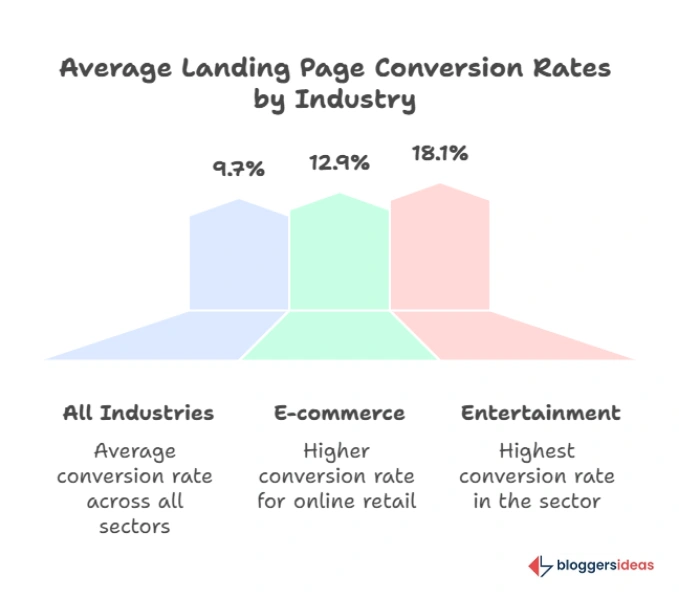
- Across all industries, the average landing page conversion rate is 9.7%.
- E-commerce landing pages exhibit an average conversion rate of 12.9%.
- Entertainment landing pages boast an even higher average conversion rate of 18.1%.
These figures demonstrate the immense potential of well-optimized landing pages to drive conversions. The number of landing pages can also influence lead generation; increasing the number of landing pages from 10 to 15 can boost leads by 55%, and websites with 40 or more landing pages generate 12 times more leads. Despite this, 62% of businesses currently have six or fewer landing pages, indicating a substantial missed opportunity for lead generation.
Adding a video to a landing page can dramatically increase conversion rates by 80%. Furthermore, 39% of B2B marketers consider landing pages an effective tool for acquiring newsletter subscribers, highlighting their versatility.
General conversion rate statistics show that the average landing page conversion rate across all industries stands at 5.89%. While 2-3% is often seen as a relaxing benchmark, the top 25% of websites achieve twice that rate, and “unicorn” websites hit an impressive 11.45%.
Longer landing pages also tend to generate more leads, with 220% more leads than shorter ones, though businesses should test what works best for their specific audience.
The importance of website loading speed cannot be overstated; a slow-loading website can reduce conversion rates by 7%.
Many online discussions, particularly on Reddit and Quora, reveal users asking about the optimal length for landing pages, the impact of dynamic content, and advanced A/B testing strategies beyond simple headline changes, indicating a growing sophistication in user queries about CRO.
The most popular form of CRO is A/B testing, with 60% of marketing experts utilizing it, underpinning its fundamental role in optimization.
Advanced CRO Strategies and Emerging Trends from Online Communities
Online communities like Quora and Reddit offer a pulse on emerging CRO discussions and pain points beyond traditional statistics. Users are increasingly asking about:
- Dynamic Content Personalization: How to implement real-time content changes based on user behavior, location, or past interactions to boost conversion rates beyond simple demographic segmentation. They want to know the best tools and frameworks for achieving this at scale.
- AI and Machine Learning in CRO: Questions frequently arise about using AI for predictive analytics, automated A/B testing, and identifying hidden conversion barriers. Users are eager to understand how AI can move CRO from reactive testing to proactive optimization.
- Voice Search Optimization for Conversions: With the rise of voice assistants, marketers are curious about how to optimize their sites and content to convert users who arrive via voice queries, particularly for local businesses.
- The Nuances of Micro-Conversions: Beyond the main goal (e.g., a purchase), users are discussing how to track and optimize smaller, supportive actions (e.g., adding to cart, viewing product details, downloading a brochure) that lead to a macro-conversion.
- Ethical CRO: There’s a growing conversation around balancing aggressive optimization techniques with user privacy and ethical considerations, ensuring trust is maintained.
- CRO for Subscription Models: Specific challenges and successful tactics for converting trial users into paying subscribers, including pricing page optimization and onboarding flow improvements.
- Integrating CRO with SEO and Content Marketing: How to ensure that content creation and search engine optimization efforts are aligned with conversion goals from the outset, rather than being treated as separate silos. One common question is how to write long-form content (like this article) that not only ranks well but also converts, considering that articles with 3000 words reportedly get twice the conversion and 24% more shares than shorter articles.
These discussions highlight a move towards more integrated, intelligent, and user-centric CRO strategies, pushing beyond basic A/B testing to encompass a holistic approach to the customer journey.
Techniques such as placing Click Through Rate elements just before the fold can increase conversion rates by 317%, and titles containing questions can generate 15% more clicks.
Using clickable CTA text within blogs can dramatically increase conversion rates by 121%, while user-generated content acts as a conversion catalyst, boosting rates by 3.2%. Removing the navigation bar from landing pages can double conversion rates, and personalized CTAs achieve a remarkable 202% better conversion rate.
Adding a floating coupon to a landing page also increases Click Through Rate by 12%. Finally, every second a page takes to load can cause the e-commerce conversion rate to drop by 0.3%, reiterating the critical role of speed.
FAQs About CRO Statistics
1. What is Conversion Rate Optimization (CRO) and why is it so important for businesses in 2025?
Conversion Rate Optimization (CRO) is the process of improving a website to increase the percentage of visitors who take a desired action. In 2025, it’s vital for businesses to maximize existing traffic, boost ROI, and convert more visitors into customers without needing more traffic.
2. What are the average conversion rates across different industries in 2025?
In 2025, the average conversion rate is 2.9%, with e-commerce at 2.7%. Rates vary by industry, with finance ranging from 5.01% to 15% and B2B e-commerce at 4%.
3. How much are businesses investing in CRO, and what kind of ROI can they expect?
Businesses are increasingly investing in CRO, with some dedicating up to 30% of their marketing budget. On average, companies spend $2,000/month on CRO tools, yielding a strong 223% ROI. Some even see returns above 1,000%, highlighting the significant impact of CRO on business performance.
4. What are some key strategies and tools used for effective CRO?
Key CRO strategies include A/B testing, UX testing, personalization, and content testing. Other tactics are improving site speed, adding videos, personalizing CTAs, and using exit-intent pop-ups to boost conversions.
5. What are some of the biggest challenges businesses face when implementing CRO, and what new trends are emerging?
Businesses struggle with buy-in, CRO processes, and converting leads. Emerging trends include AI-driven analytics, personalization, ethical CRO, and optimizing for micro-conversions and voice search.
Also Read:
Conclusion: CRO – A Non-Negotiable for Digital Success in 2026
Conversion Rate Optimization (CRO) is no longer a niche strategy but a fundamental pillar of digital success for businesses in 2025. With average industry conversion rates around 2.9% and e-commerce slightly lower at 2.7%, there is a clear imperative to optimize.
The impressive global average website conversion rate of 3.68% and the strong 3.2% for paid search campaigns underscore the significant opportunities that CRO unlocks.
Businesses are increasingly recognizing the profound impact of CRO, dedicating substantial portions of their marketing budgets—up to 30%—to these efforts. The astounding average ROI of 223% from CRO tools provides a compelling financial argument for this investment.
As the market for CRO tools is poised to grow to $5.07 billion by 2025, it is evident that businesses prioritizing CRO are not only enhancing their customer experience but also achieving a substantial boost to their financial performance.
By understanding these statistics, embracing strategic optimization, and staying attuned to emerging trends and user needs, businesses can effectively navigate the competitive digital landscape and convert their online potential into tangible, measurable growth.