Screens are now a major part of everyday life. People use them for work, learning, entertainment, and staying connected.
Average screen time statistics 2025 show just how much time we spend looking at phones, computers, and TVs—and why managing screen habits matters more than ever.
In 2025, people worldwide spend about 6 hours and 45 minutes per day on screens. In the United States, adults average 7 hours and 2 minutes daily, while teenagers often go beyond 8 hours a day.
These numbers help you understand how digital habits affect health, productivity, and family life.
This guide breaks down screen time by age, country, device, and activity, using the latest data up to Q3 2025.
You’ll also learn practical ways to reduce unhealthy screen use and turn screen time into something more useful and balanced.
Global Average Screen Time in 2026
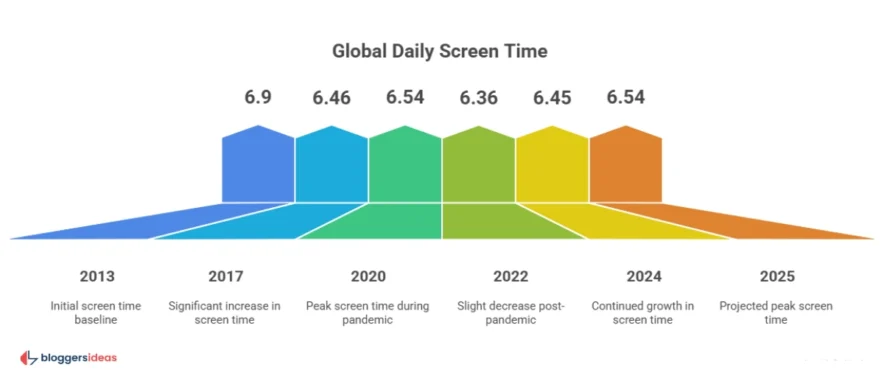
Worldwide screen time continues to rise steadily. In 2025, the global daily average is 6 hours and 45 minutes, which equals 47 hours and 15 minutes per week.
Experts expect this number to reach 6 hours and 54 minutes by the end of Q3 2025.
While adult screen time dropped slightly after the pandemic, long-term trends still show growth due to mobile phones, streaming, and remote work.
Global Screen Time Over Time
| Year (Q3) | Avg Daily Screen Time | Change |
|---|---|---|
| 2013 | 6h 9m | – |
| 2017 | 6h 46m | +4.3% |
| 2020 | 6h 54m | +4.2% |
| 2022 | 6h 36m | -5.1% |
| 2024 | 6h 45m | +1.25% |
| 2025* | 6h 54m | +2.22% |
*Projected
What this means for you:
Use these averages as a reference. If your screen time is much higher, small changes—like phone-free evenings—can make a big difference.
Also read about: Mobile Internet Traffic Statistics
Screen Time in the United States
Adults in the U.S. spend about 7 hours and 2 minutes per day on screens. This number has stayed mostly stable since 2021.
Total media use equals 59 hours and 56 minutes per week, or 8 hours and 34 minutes daily, across TV, phones, computers, and apps.
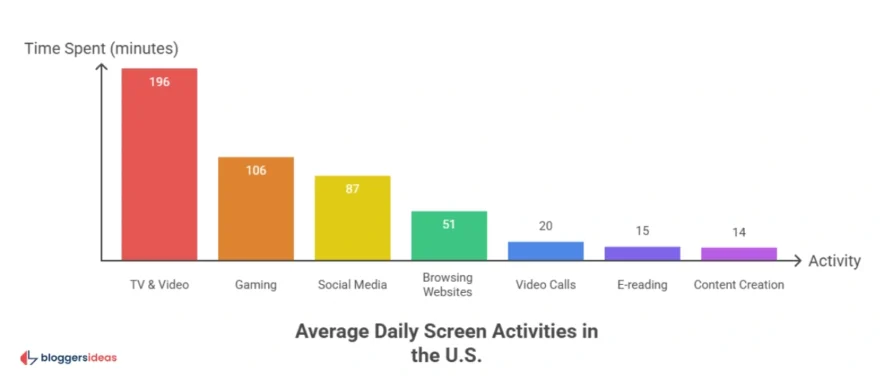
Average Daily Screen Activities (U.S. Adults)
| Activity | Time Spent |
|---|---|
| TV & Video | 3h 16m |
| Gaming | 1h 46m |
| Social Media | 1h 27m |
| Browsing Websites | 51m |
| Video Calls | 20m |
| E-reading | 15m |
| Content Creation | 14m |
Tip:
Replacing some entertainment time with educational videos or skill-building apps can improve productivity without cutting screens completely.
Also read about: Mobile App Download Statistics
Screen Time by Age and Gender
Younger people spend the most time on screens. Gen Z leads all groups, while older adults spend much less time online.
Daily Screen Time by Age & Gender
| Age Group | Female | Male |
|---|---|---|
| 16–24 | 7h 35m | 7h 11m |
| 25–34 | 7h 17m | 7h 13m |
| 35–44 | 6h 43m | 6h 37m |
| 45–54 | 6h 7m | 6h 4m |
| 55–64 | 5h 18m | 5h 21m |
| 65+ | 4h 7m | 3h 59m |
Screen Time by Generation
| Generation | Avg Daily Screen Time |
|---|---|
| Gen Z | 9 hours |
| Millennials | 6h 42m |
| Gen X | 4h 10m |
| Baby Boomers | 3h 31m |
Insight:
Many Gen Z users say they overuse smartphones. Tools like blue-light filters and screen-time reminders can help reduce eye strain and improve sleep.
Also read about: Smartphone Usage Statistics
Countries with the Highest Screen Time
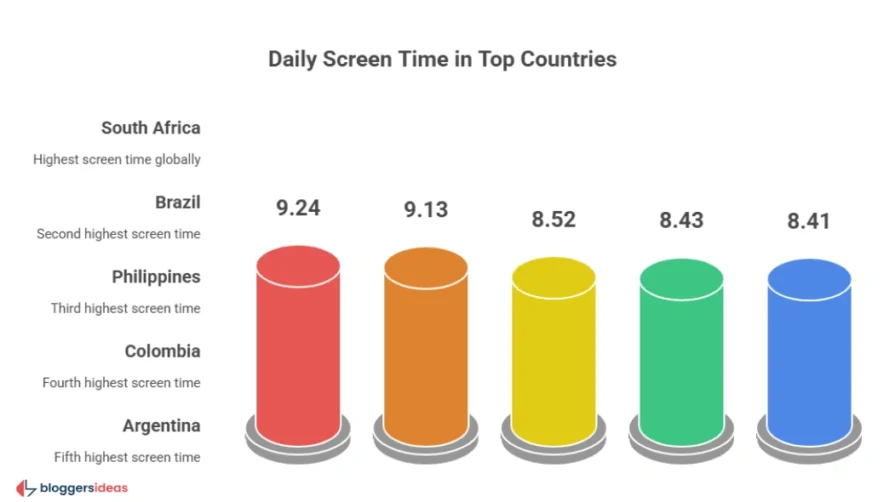
Screen habits vary widely across countries.
Top Countries by Daily Screen Time
| Rank | Country | Time |
|---|---|---|
| 1 | South Africa | 9h 24m |
| 2 | Brazil | 9h 13m |
| 3 | Philippines | 8h 52m |
| 4 | Colombia | 8h 43m |
| 5 | Argentina | 8h 41m |
Japan records the lowest screen time at 4 hours and 9 minutes daily.
Takeaway:
Lower-screen cultures often prioritize offline activities. Adding walks, hobbies, or family time can help reduce digital overload.
Device Usage: Mobile Takes the Lead
Smartphone Screen Time
Smartphones account for 53% of total screen time, with users averaging 4 hours and 37 minutes per day.
| Country | Daily Smartphone Use |
|---|---|
| Ghana | 5h 43m |
| Philippines | 5h 21m |
| Brazil | 5h 12m |
Computer Screen Time
Computers make up 47% of total screen time, averaging 3 hours and 14 minutes daily.
South Africa leads with 5 hours and 37 minutes on desktops.
Also read about: iPhone vs Android Statistics
Streaming & Social Media Usage
Streaming Time (U.S.)
| Platform | Daily Time |
|---|---|
| Hulu | 2h 10m |
| Netflix | 1h 50m |
| Amazon Prime | 1h 37m |
| Disney+ | 1h 29m |
Social Media Screen Time
Globally, users spend 2 hours and 31 minutes per day on social media in 2025.
TikTok leads with 1.5 hours per user daily.
Children and Screen Time
- 74% of U.S. parents say their 2-year-olds watch TV
- Tweens (8–12): 5h 33m daily
- Teens: 8h 39m daily
Children’s App Usage
| App | Time |
|---|---|
| TikTok | 1h 53m |
| Snapchat | 1h 30m |
| 20m |
Parental Controls
| Rule Type | % of Parents |
|---|---|
| No limits | 40% |
| Daily limits | 27% |
| Weekends only | 29% |
| No use allowed | 4% |
Also read about: iPhone Users Statistics
Health Risks of Excessive Screen Time
Excess screen use is linked to several health concerns:
| Condition | Linked Risk |
|---|---|
| Obesity | 23% |
| Type 2 Diabetes | 15% |
| Heart Disease | 12% |
| Sleep Issues | High |
| Depression | 6% |
Doctors recommend:
- Adults: Max 2 hours leisure screen time/day
- Children under 2: No screen time
Yet 87% of children exceed these limits.
Smart Ways to Manage Screen Time
You can improve balance without quitting screens completely:
- Track weekly screen time
- Set app limits
- Use night mode and blue-light filters
- Create screen-free zones at home
- Replace scrolling with learning apps or audiobooks
- Join Reddit challenges for motivation
FAQs About Scredn Time Statistics
1. What is the global average screen time in 2025?
About 6 hours and 45 minutes per day worldwide.
2. Which age group spends the most time on screens?
Gen Z, averaging 9 hours daily.
3. Which country has the highest screen time?
South Africa at 9 hours and 24 minutes per day.
4. What are the main health risks?
Obesity, sleep problems, and diabetes.
5. How can I reduce screen time easily?
Use tracking apps, set limits, and add screen-free activities like walking or reading.
Also Read:
- Android Usage Statistics
- Coupon Statistics
- Android Usage Statistics
- Content Marketing Statistics
- Live Streaming Statistics
Conclusion: Use Screen Time Wisely in 2025
Average screen time statistics 2025 show a world deeply connected to digital devices, with people spending 6 hours and 45 minutes daily on screens.
While overuse can harm health, mindful habits can turn screen time into a powerful tool for learning, productivity, and connection.
By tracking usage, setting limits, and choosing better content, you can create a healthier balance—one that supports your goals, relationships, and well-being in a digital-first world.