Smartphones have profoundly reshaped our daily lives, transforming from luxury gadgets into indispensable tools for communication, entertainment, commerce, and information access.
As we delve into smartphone usage statistics 2025, it becomes abundantly clear that these devices are not just pervasive; they are central to how billions of people interact with the digital world.
This comprehensive article explores the latest adoption trends, usage patterns, economic impacts, and emerging behaviors that define our mobile-first existence.
We will provide detailed insights for anyone looking to understand smartphone usage better and leverage its capabilities for personal or professional benefit.
The Global Surge: Smartphone Usage in 20252026
The widespread adoption of smartphones represents one of the most significant technological shifts in human history. In 2025, the sheer scale of smartphone penetration is staggering, with billions of devices in circulation and an ever-growing user base.
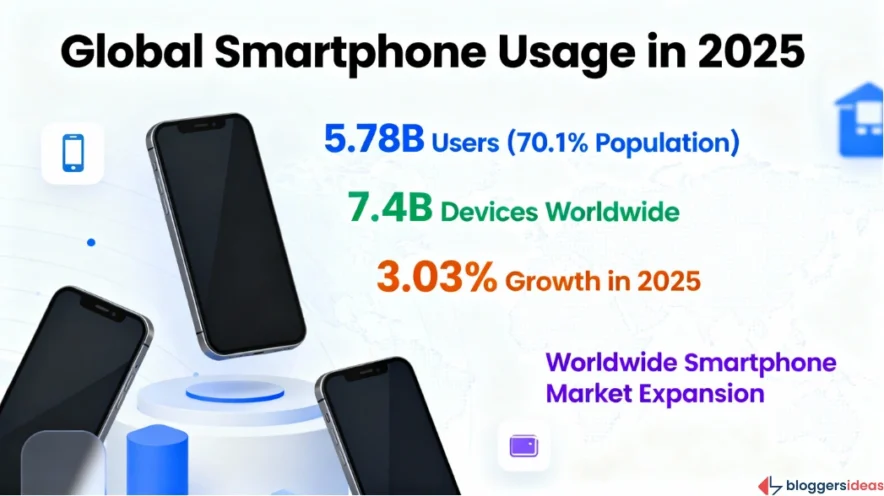
Approximately 5.78 billion people use smartphones globally, representing an impressive 70.1% of the world’s estimated population of 8.25 billion. This figure underscores the immense reach of these devices, touching nearly every corner of the planet.
While individual ownership varies, the total number of smartphones in use is even higher, reaching 7.4 billion devices worldwide. This discrepancy highlights that many individuals own more than one smartphone, and businesses often manage thousands of devices.
The global smartphone market continues its expansion, with a projected growth of 3.09% in 2025 compared to the previous year, pushing the number of smartphone users to an estimated 7.434 billion.
Also read about: Smartwatches Statistics
Smartphone Penetration Rates:
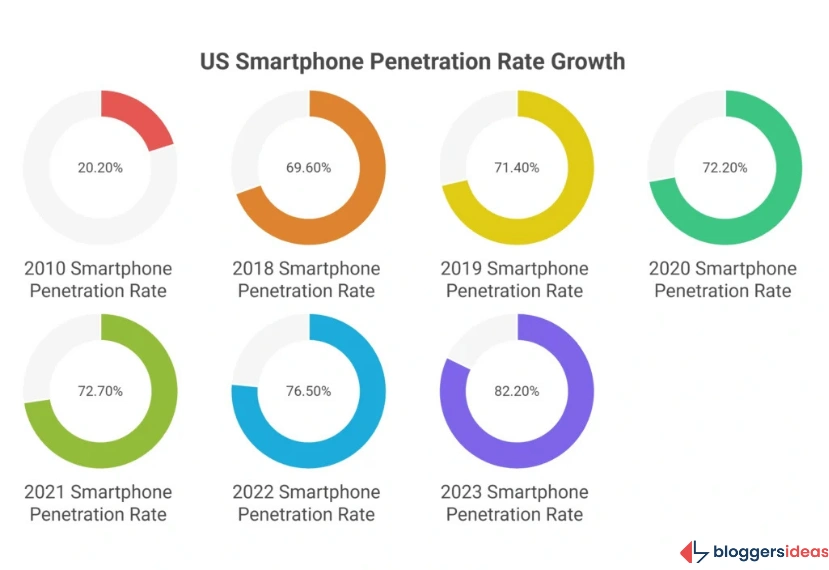
Smartphone penetration rates reveal interesting disparities across countries. The United States leads among developed nations, with 82.2% of its population owning a smartphone in the latest data.
This marks a substantial increase from just 20.2% in 2010, illustrating a rapid and widespread adoption over little more than a decade. The United Kingdom follows closely with a 79.8% penetration rate, while France and Germany each boast 78.8%. Italy rounds out the top five with 77%.
Here is a table displaying the smartphone penetration rate in the United States over time:
| Year | Smartphone Penetration Rate in the United States |
| 2010 | 20.20% |
| 2018 | 69.60% |
| 2019 | 71.40% |
| 2020 | 72.20% |
| 2021 | 72.70% |
| 2022 | 76.50% |
| 2023 | 82.20% |
Meanwhile, in developing economies, smartphone adoption rates, while growing, remain significantly lower. For instance, only 55.4% of the Brazilian population owns a smartphone, a figure that drops to 35.4% in India.
In Nigeria, less than one in five people (19.7%) are smartphone users, highlighting vast opportunities for future growth in these markets.
Here is a list of the top 5 countries with the highest smartphone penetration rate:
- The United States: 82.2%
- The United Kingdom: 79.8%
- France: 78.8%
- Germany: 78.8%
- Italy: 77%
Also read about: iPhone Users Statistics
Demographics of Smartphone Usage: Who is Using These Devices?
Understanding the demographic breakdown of smartphone users provides crucial insights for targeted communication and product development. Age, gender, geographic location, and socioeconomic status all play a role in smartphone ownership and usage patterns.
Age-Related Smartphone Usage
Smartphones enjoy near-universal adoption among younger and middle-aged adults. In the United States, an impressive 97% of adults aged 18 to 29, and similarly 97% of those aged 30 to 49, own a smartphone.
This figure gradually decreases with age, with 89% of individuals aged 50 to 64 possessing a smartphone. Among those over 65 years old, 76% own a smartphone, demonstrating that while adoption is lower, a substantial majority of seniors are still embracing mobile technology.
Here are further details about the percentage of smartphone usage by age group in the US:
| Age Group | Percentage of Smartphone Users |
| 18 to 29 | 97% |
| 30 to 49 | 97% |
| 50 to 64 | 89% |
| Over 65 years | 76% |
Gender, Education, and Income Disparities
In the US, there exists a slight gender disparity, with 80% of males owning a smartphone compared to 75% of females. However, this difference is relatively small.
Education level shows a positive correlation with smartphone ownership; college graduates are the most likely to own a smartphone (91% smartphone-only ownership), while those with less than a high-school education show lower rates (57% smartphone-only ownership).
Similarly, annual salary positively correlates with smartphone ownership, with 93% of Americans earning over $75,000 a year owning a smartphone, compared to 67% of those earning under $30,000.
Interestingly, 27% of individuals in households earning less than $30,000 per year use their smartphones as their primary means of internet access, highlighting the device’s role in bridging the digital divide for some.
Also read about: Android Usage Statistics
The Time Commitment: How Much Time Do People Spend on Smartphones?

The ubiquitous presence of smartphones in our lives translates into significant daily usage times, underscoring their role as primary interaction points with the digital world.
In the United States, almost half of the population, specifically 48% of people, spend between 5 to 6 hours on their smartphones daily.
This equates to over 132 million users, indicating a deep integration of these devices into daily routines. Only a small fraction, 5% of smartphone users, spend less than one hour daily on their devices.
Here is a table showing the daily time spent on smartphones in the United States:
| Daily Hours Spent on Smartphones | Percentage of Smartphone Users | Number of Smartphone Users (in millions) |
| Less than 1 hour | 5% | 13.76 |
| 1 to 2 hours | 7% | 19.27 |
| 3 to 4 hours | 22% | 60.56 |
| 5 to 6 hours | 48% | 132.13 |
| More than 6 hours | 18% | 49.55 |
Globally, the average daily time spent on smartphones is 3 hours and 43 minutes. However, this average masks significant regional variations.
The Philippines leads with an average daily screen time of 5 hours and 47 minutes, followed by Thailand (5 hours 28 minutes) and Brazil (5 hours 25 minutes). Only one European nation, Turkey, exceeds the global average, with a daily screen time of 4 hours and 16 minutes.
Smartphones now account for a staggering 70% of all digital media time in the United States. A large portion of this time is dedicated to apps, with games (94%) and social media (92%) dominating consumption.
Education (77% share) and government services remain the only two forms of digital media that still primarily rely on desktops, indicating a clear mobile-first trend for most other activities.
Also read about: Apple Music Statistics
Activities on Smartphones: What Are Users Doing?
Smartphones serve as multi-functional devices, enabling a vast array of activities that cater to both personal and professional needs. Understanding these activities is key to appreciating the device’s utility.
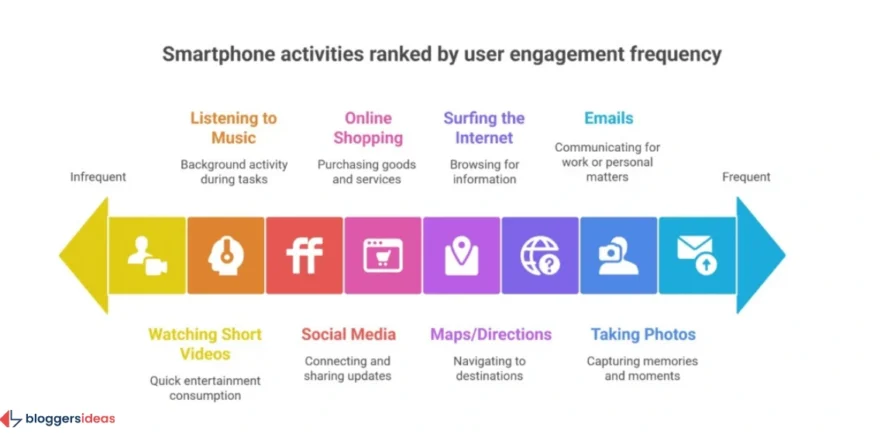
A broad spectrum of activities defines smartphone usage. 83% of people use their smartphones for emails and capturing images, highlighting their roles in communication and personal documentation.
Surfing the internet (76%) and using maps/directions (73%) are also primary functions. Online shopping (71%), checking/posting on social media (67%), and listening to music/podcasts (66%) further underscore the device’s versatility.
Here is a comprehensive list of common smartphone activities and their share among respondents:
| Smartphone Activity | Share of Respondents |
| Emails | 83% |
| Taking Photos | 83% |
| Surfing the Internet | 76% |
| Maps/Directions | 73% |
| Online Shopping | 71% |
| Check/Post Social Media | 67% |
| Listening To Music/Podcasts | 66% |
| Watch Short Videos (Clips/Messages) | 65% |
| Online Banking | 60% |
| Video Calls | 59% |
| Taking Videos | 58% |
| Reading news | 58% |
| General purpose apps | 57% |
| Playing Games (Apps) | 52% |
| Watch long videos (Movies/TV) | 44% |
| Online Video Gaming | 35% |
Millennials, in particular, exhibit high engagement with video content, with 78% watching videos on smartphones at least once weekly. Social media also remains popular, with 64% of millennials using it, alongside listening to music (62%) and playing games (54%).
Emerging Trends in Smartphone Usage 2025
The landscape of smartphone usage is dynamic, continuously evolving with technological advancements and shifting user behaviors. Several key trends are shaping the future of how we interact with these devices.
- Soaring Mobile Data Consumption: Average monthly mobile data usage has reached 23 GB per smartphone user, a significant increase from 15 GB in 2022. This surge is primarily driven by high-bandwidth activities such as video streaming, cloud gaming, and the adoption of augmented reality (AR) and virtual reality (VR) content, especially with the ongoing rollout of 5G networks.
- Continued User Growth: Cell phone usage is projected to grow by 2-3% year-over-year by 2025. This seemingly modest percentage translates into nearly one billion new users, indicating that the global smartphone user base will continue its upward trajectory. The number of smartphone users is expected to reach 7.34 billion by 2025, up from 6.8 billion in 2023.
- Increased App Engagement: Smartphone app usage time in the United States has increased by 25% since 2019, reflecting a global trend where overall app usage time has risen by 30%. India leads this trend with an 80% increase in smartphone app usage time, followed by Russia and Indonesia at 50% and 45%, respectively.
- E-commerce Dominance: Mobile devices now account for 65% of all e-commerce traffic and drive 73% of total e-commerce sales. This highlights the undeniable shift towards mobile commerce, with social media-triggered purchasing emerging as a leading trend, as 55% of buyers make purchases after seeing products on social platforms. Events like Cyber Monday and Black Friday increasingly see mobile devices driving a significant portion of sales.
- 5G Acceleration: Global 5G connections are forecast to surpass 1 billion in 2025, playing a crucial role in enhancing mobile experiences. The faster speeds and lower latency of 5G networks are driving a rapid increase in streaming, cloud gaming, and AR/VR adoption on mobile, opening new possibilities for immersive content and applications.
These trends collectively paint a picture of a world increasingly reliant on smartphones for a multitude of tasks, with mobile data consumption, app usage, and mobile commerce continuing their ascent.
The Rise of Mobile E-commerce: M-commerce Statistics
Mobile e-commerce, or m-commerce, has become a cornerstone of the retail industry, driven by the convenience and accessibility offered by smartphones. The statistics underscore its pivotal role in today’s economy.
M-commerce now accounts for a staggering 73% of all e-commerce transactions. This represents a dramatic increase from 39.1% in 2016, illustrating a rapid and sustained shift in consumer purchasing habits towards mobile devices.
This percentage is expected to continue rising in the coming years, further solidifying mobile’s dominance in online retail.
- High Retail App Engagement: A significant 35% of mobile users utilize retail apps multiple times a week. Furthermore, 21% report using these apps multiple times daily, while 22% use them once daily. This intense engagement highlights the effectiveness of dedicated mobile shopping applications.
- Social Media’s Influence on Purchases: A compelling 55% of buyers make mobile purchases after discovering products on social media platforms. Retailers with a strong social media presence often experience a 32% increase in sales compared to competitors, with up to 90% of consumers purchasing from brands they follow online.
- Mobile Dominance in Sales Events: During major shopping events, smartphones play a crucial role. 40% of sales on Cyber Monday are attributed to mobile devices, contributing to billions in online spending. Similarly, 48% of online sales during Black Friday 2022 were made through smartphones, reinforcing their importance for last-minute and impulse purchases.
- Traffic vs. Sales Conversion: While mobile devices drive a substantial 65% of all e-commerce traffic, desktop traffic still tends to generate a slightly higher proportion of sales. Mobile accounts for 53% of sales, while desktop contributes 47%, suggesting that while discovery often happens on mobile, larger or more complex purchases might still conclude on desktop.
- Challenges in Mobile Shopping Experience: Despite the growth, 88% of mobile shoppers have experienced negative shopping interactions at least once. Common issues include navigation difficulties (51%), small images (46%), security concerns (41%), and complex checkout processes (26%). These frustrations lead to 36% of customers abandoning their carts, emphasizing the critical need for optimized mobile retail experiences.
The number of mobile shoppers in the United States is projected to reach 187 million, growing by at least 11% in the next three years, underscoring the expanding market for mobile retail.
Smartphone Reliance and Addictiveness: The Dark Side of Connectivity
The deep integration of smartphones into daily life has, for many, blurred the line between utility and dependency, giving rise to significant concerns about reliance and potential addiction.
- Constant Interaction: In the United States, smartphone users touch their phones an average of 2,617 times daily. For frequent users, this figure can exceed 5,000 touches. On average, users unlock their devices at least 150 times daily, checking their phones every 10 to 12 minutes. An alarming 66% of US smartphone users check their phones as many as 160 times daily, suggesting a high degree of habituation.
- Nomophobia: The Fear of Being Without a Phone: An astounding 99.2% of smartphone users exhibit symptoms of nomophobia, defined as the fear or anxiety of being without one’s mobile phone. Of these, 37% experience mild symptoms, 50% moderate, and 13% severe cases. This phenomenon is particularly pronounced among college students, with 89% reporting moderate to severe nomophobia, and affecting 66% of adults in the US.
- Impact on Teenagers: Teenagers show a strong attachment to their phones. 72% of teenagers check messages and notifications immediately after waking up. More concerning, 56% of teenagers report feeling lonely, distressed, or anxious without their phones, and 54% admit to spending too much time on their devices. This level of reliance contributes to a higher risk of depression, with 27% of teenagers being identified as at risk.
- Educational Distractions: The presence of smartphones in classrooms poses a significant challenge. 76.19% of teachers observe that smartphones distract students in class. Nearly half (45%) of students confess to being online constantly, even during lessons, and 20% admit to using their smartphones for non-academic activities in class.
- Early Adoption: The trend of early smartphone ownership is accelerating. Approximately 20% of children own a smartphone by the age of eight, and by age 11, 53% of children in the United States have their own device. Generation Z, on average, receives their first mobile phone at 10.3 years old.
These statistics collectively paint a vivid picture of a society deeply intertwined with smartphones, raising important questions about digital well-being, mental health, and the need for mindful usage.
Mobile Traffic Statistics: The Internet’s Mobile Frontier
Mobile traffic has decisively surpassed desktop and tablet traffic, establishing smartphones as the primary gateway to the internet for billions worldwide.
- Dominance in Web Traffic: More than 56.1% of global web traffic now originates from smartphones. This figure has seen a dramatic increase from just 10.88% in 2012, soaring to 54.09% by 2017, and reaching 56.86% in 2023. This sustained growth underscores the mobile-first nature of internet consumption.
- Quarterly Trends: In Q1 2023, 58.33% of total web traffic came from mobile devices globally. While this represented a slight decrease from Q4 2022 (59.16%), the peak mobile traffic recorded between Q1 2015 and Q1 2023 was 59.54% in Q3 2022, demonstrating consistently high mobile engagement.
- Smartphone’s Share of Internet Access Devices: As of June 2025, smartphones account for an overwhelming 94.2% of all devices used by people aged 16+ to access the internet. This figure highlights how smartphones have become almost synonymous with internet access for the vast majority of users, further solidifying their indispensable role in our digital lives.
Here is a table showing the evolution of global mobile web traffic:
| Year | Mobile Traffic |
| 2012 | 10.88% |
| 2013 | 17.02% |
| 2014 | 28.97% |
| 2015 | 37.24% |
| 2016 | 45.91% |
| 2017 | 54.09% |
| 2018 | 53.01% |
| 2019 | 52.26% |
| 2020 | 53.07% |
| 2021 | 56.53% |
| 2022 | 59.66% |
| 2023 | 56.86% |
Smartphone Market Share: Operating Systems and Brands
The smartphone market is primarily dominated by two operating systems and a handful of powerful brands, constantly vying for consumer preference and technological supremacy.
Operating System Dominance
The mobile operating system market is largely a duopoly. Android holds a commanding 71.31% OS market share globally, thanks to its widespread adoption across numerous manufacturers and its open-source nature.
iOS, Apple’s proprietary operating system, accounts for 27.73% of the global market. Other operating systems like Samsung (0.38%), KaiOS (0.15%), and Windows (0.02%) hold significantly smaller shares.
However, the landscape shifts dramatically in the US market, where iOS takes the lead with a 55.48% market share, demonstrating Apple’s strong presence in its home country, while Android accounts for 44.27%.
Brand Competition
The smartphone brand market has diversified over the last decade. In 2012, Samsung held almost one-third of the market, followed by Apple (18.7%). By 2020, five different brands had secured a market share of at least 8%, indicating increased competition.
Here’s a breakdown of the smartphone market split for select brands since 2012:
| Year | Samsung | Apple | Huawei | Xiaomi | OPPO | vivo | Lenovo |
| 2012 | 30.3% | 18.7% | 4% | – | – | – | 3.3% |
| 2013 | 31.3% | 15.3% | 4.9% | – | – | – | 4.5% |
| 2014 | 24.4% | 14.8% | 5.7% | 4.4% | – | – | 4.6% |
| 2015 | 22.3% | 16.1% | 7.4% | 4.9% | 3% | 2.6% | 5.2% |
| 2016 | 21.1% | 14.6% | 9.5% | 3.6% | 6.8% | 5.3% | – |
| 2017 | 21.7% | 14.7% | 10.5% | 6.3% | 7.6% | – | – |
| 2018 | 20.8% | 14.9% | 14.7% | 8.7% | 8.1% | – | – |
| 2019 | 21.6% | 13.9% | 17.6% | 9.2% | 8.3% | – | – |
| 2020 | 20.6% | 15.9% | 14.6% | 11.4% | – | 8.6% | – |
| Q2 2021 | 18.9% | 14.2% | – | 16.9% | 10.5% | 10.1% | – |
| Q2 2022 | 21.8% | 15.6% | – | 13.8% | 8.6% | 8.7% | – |
The market continues to diversify, with Chinese manufacturers like Xiaomi, OPPO, and vivo gaining significant traction alongside established players.
How Users Can Benefit from Understanding Smartphone Usage
For individuals, businesses, and content creators, understanding these smartphone usage statistics provides invaluable opportunities:
- For Businesses and Marketers: Recognize the mobile-first imperative. Optimize websites and applications for mobile devices, prioritize mobile e-commerce strategies, and leverage social media for product discovery and sales. The high mobile data usage and app engagement mean opportunities for rich, interactive mobile-first content.
- For Content Creators: Tailor content formats for mobile consumption, focusing on short videos, engaging social media posts, and easily digestible information. Consider the peak usage times and demographics to optimize content delivery.
- For Developers: Focus on creating intuitive, secure, and fast mobile applications. Address common pain points in mobile shopping experiences, such as navigation and checkout processes, to reduce cart abandonment.
- For Educators and Parents: Acknowledge the deep integration of smartphones in young people’s lives. Develop strategies for responsible digital citizenship, addressing issues of screen time, digital addiction, and classroom distractions. Utilize smartphones as educational tools, but also teach mindful usage.
- For Individuals: Be aware of your own usage patterns. Tools and features are available on most smartphones to monitor screen time and set limits, promoting a healthier digital lifestyle and mitigating the risks of nomophobia.
What Users Are Asking: Insights from Quora and Reddit
Beyond statistical reports, real-world discussions on platforms like Quora and Reddit reveal the evolving concerns and curiosities of smartphone users. These conversations provide a candid look at current pain points and desires:
- Battery Life Concerns: A recurring theme is the desire for improved smartphone battery life, especially with the increased consumption of high-bandwidth content like 5G streaming and cloud gaming. Users often ask for tips to extend battery duration or express frustration over rapid drainage.
- Digital Detox and Mindfulness: Many users are actively seeking strategies for digital detoxes or ways to reduce their screen time. Questions about apps that help monitor usage, techniques for disconnecting, and the psychological impact of constant connectivity are common, reflecting a growing awareness of potential addiction.
- Privacy and Data Security: With sensitive information increasingly stored on smartphones, users frequently inquire about best practices for protecting their privacy, securing their data, and understanding how apps collect and use their personal information.
- Smartphone Longevity and Repairability: There’s a noticeable trend of users asking about the longevity of their devices and the ease of repair. As phone prices increase, consumers are looking for ways to extend the life of their smartphones rather than constantly upgrading, leading to questions about sustainable smartphone usage.
- AI Integration and Smart Features: Users are curious about the practical applications of AI in their smartphones, beyond basic voice assistants. They often ask about new AI features, how AI enhances daily tasks, and the future potential of artificial intelligence directly on their devices.
These discussions highlight a collective move towards more conscious and informed smartphone usage, coupled with a demand for more robust, sustainable, and intelligent mobile experiences.
FAQs About Smartphone Usage Statistics
Q1: How many people worldwide are expected to own a smartphone in 2025?
By 2025, the number of smartphone users globally is projected to reach approximately 7.434 billion, reflecting a continuous and significant increase in smartphone adoption.
Q2: How much time do people typically spend on their smartphones daily in the United States?
In the United States, almost half of the population (48%) spends between 5 to 6 hours on their smartphones daily, highlighting the deep integration of these devices into everyday life.
Q3: What percentage of global web traffic originates from smartphones?
As of 2025, more than 56.1% of global web traffic comes from smartphones, firmly establishing them as the dominant channel for internet access worldwide.
Q4: How does mobile commerce contribute to overall e-commerce sales?
Mobile commerce (m-commerce) accounts for a substantial 73% of all e-commerce sales, demonstrating its critical role in today’s retail landscape and consumer purchasing habits.
Q5: What is nomophobia, and how prevalent is it among smartphone users?
Nomophobia is the fear or anxiety of being without one’s mobile phone, and an alarming 99.2% of smartphone users exhibit some level of its symptoms, underscoring the widespread reliance on these devices.
Also Read:
- Mobile Internet Traffic Statistics
- Generative AI Statistics
- AI Market Size Statistics
- Google Chrome Statistics
- Internet Usage Statistics
Conclusion: The Ubiquitous Future of Smartphones
Smartphones sit at the center of daily life in 2025, connecting 5.78 billion users and driving most online activity, e-commerce traffic, and digital media consumption.
With device numbers expected to exceed 7.4 billion, mobile remains the primary gateway to the internet across much of the world.
Rising data usage and fast 5G expansion fuel richer, more immersive experiences, but also bring concerns around screen time, privacy, and digital balance.
As AI advances and new forms of interaction emerge, understanding smartphone usage trends helps people and businesses adapt, stay competitive, and use mobile technology more intentionally in an increasingly connected future.