Meeting statistics for 2025 show that hybrid work dominates. Professionals spend 11.3 hours a week in meetings—28% of their workweek.
The U.S. hosts 11 million meetings daily, a number that tripled since 2020. However, 35% of this time is wasted, costing $259 billion annually.
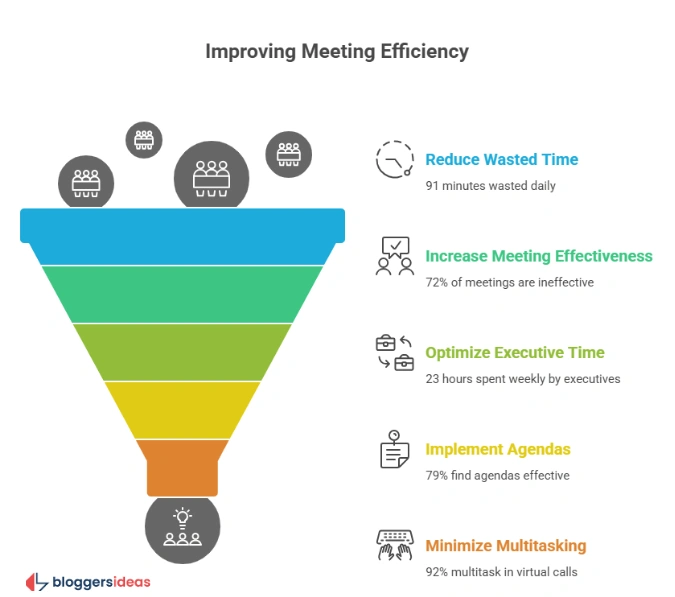
To boost productivity, schedule meetings between 9:30 AM and 3:30 PM on Tuesdays for peak focus. Ensure agendas are set in 37% of meetings to cut meeting length by 80%. AI tools like Notta offer 98.86% accurate transcriptions, saving 5 hours each week from follow-ups.
Remote meetings make up 86% of meetings, but 72% suffer from tech glitches. Fixing AV equipment can increase engagement by 34%.
Blocking off calendars is a practice used by 58% of professionals to protect time for deep work, especially among caregivers (67%).
Discussions on Reddit’s r/productivity recommend “no-meeting Wednesdays” to cut overload by 16%. Quora threads also discuss AI note-takers, highlighting a need for better multilingual transcription, especially in Spanish.
You can integrate this by setting focus statuses in Outlook, declining unnecessary invites, and using calendar blocking to protect 392 hours annually.
This will transform meetings into decision-driving events, with 68% moving projects forward.
Surge in Meeting Volume
Meeting statistics 2025 confirm explosive growth, with 11 million U.S. meetings daily equating 55 million weekly and over 1 billion yearly, as remote work spikes attendance 13.5% per Harvard, tripling overall since 2020 per Microsoft.
Employees average 11.3 hours weekly (Fellow), 83.13% up to one-third workweek (Dialpad), executives 23 hours doubling 1960s levels, CEOs 37 meetings at 72% time.
You harness this: limit to 3-4 daily (46% attend), auto-shorten to 25/50 minutes (5.4% do), or introduce no-meeting days to reclaim 392 hours yearly for tasks, boosting output where 55% say meetings enhance productivity.
The table below breaks weekly hours by role, guiding caps—executives block post-3 PM for strategy.
| Role | Average Weekly Hours | % of Workweek | Optimization Tip |
| Individual Contributor | 8 | 20% | Batch afternoons; agenda mandatory |
| Manager | 16 | 40% | Delegate; ad-hoc <57% |
| Executive | 19+ | 47.5%+ | Focus mornings; AI summaries |
| CEO | 23 | 57.5% | 37 max; decision-only |
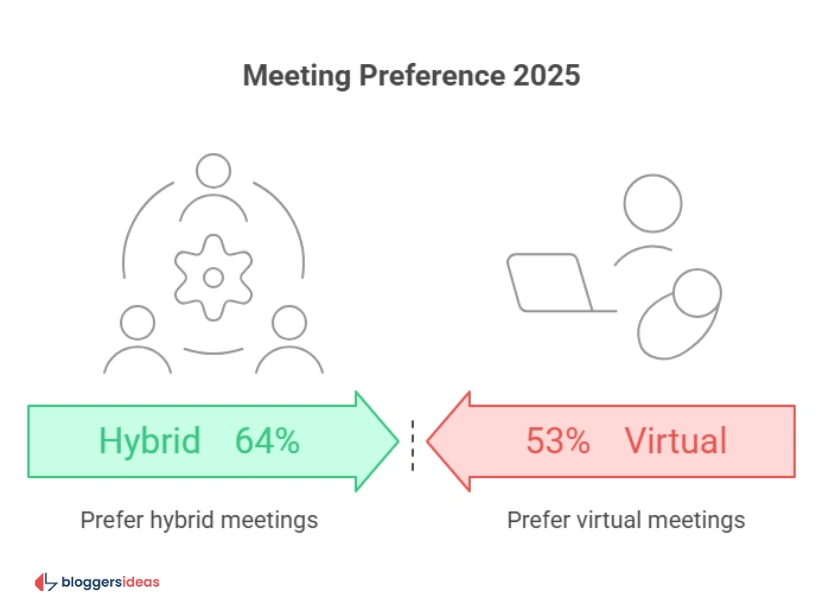
83% attend in-person weekly (Owl Labs), but remote 50% more; hybridize for 64% preference.
Also read about: Zoom Statistics 2026
Time Allocation Patterns: Peak Hours and Preferred Days
Meeting statistics 2025 cluster 50% between 9-11 AM or 1-3 PM (Microsoft), Tuesdays 23% weekly, Fridays 16%, overloading 11 AM. 70% favor 8 AM-noon (Doodle), 73% reject pre-8 AM.
You schedule smart: Tuesdays 2:30 PM per YouCanBookMe’s 2 million data, avoid Mondays (47% worst), or block for deep work where chats peak.
This table maps daily preferences, aligning with energy—mornings for decisions.
| Day | % of Weekly Meetings | Best Time Window | Avoidance Reason |
| Monday | N/A | N/A | 47% worst; post-weekend ramp |
| Tuesday | 23 | 9:30 AM-3:30 PM | Productive; 29% favor |
| Wednesday | N/A | 9:30 AM-3:30 PM | 25% prefer |
| Thursday | N/A | Afternoons | Balanced |
| Friday | 16 | Mornings | Wind-down; 40% second-worst |
94% under 60 minutes (Flowtrace), 45% 30 minutes; enforce for attention within 30 (52% lose).
Also read about: GoToMeeting Coupon Codes 2026: Enjoy 65% Off Now
Virtual Meeting Dominance
Meeting statistics 2025 position virtual at 86% with remote (Owl Labs), up from 48% 2020 to 77% 2022, market $7.26 billion. 70% less stressful, 67% productive as in-person.
You excel: on-camera for 43% productivity (reduces 66% multitasking), or audio-only 82.9% non-sharing. 10.1 weekly virtual (HBR).
The table contrasts formats, favoring hybrid for 49% attendance.
| Format | % of Meetings | Preference (%) | Benefit for You |
| Virtual | 33 | 53 | Convenient; 71% easier present |
| In-Person | 14 | 47 | Relationships; 79% excited colleagues |
| Hybrid | 53 | 64 | Balanced; 49% attend both |
88% resumed in-person (TravelPerk), 25% mainly physical.
Also read about: ClickMeeting Coupon Code 2026: Save 72% Now
In-Person and Hybrid Resurgence: 88% Planning Events, 64% Prefer Hybrid
Meeting statistics 2025 show hybrid 49% attendance, 64% pandemic remote prefer, 88% companies plan physical (50% team-building). 47-50% favor in-person vs. 53% virtual.
You blend: hybrid for multi-zone (33%, up 35%), in-person all-hands (65%).
This table segments by type, prioritizing for impact.
| Type | % Attendance/Preference | Key Stat |
| Mainly In-Person | 25 | 79% build relationships |
| Mainly Online | 26 | 70% less stress |
| Hybrid | 49 | 64% top style |
79% excited colleagues; prioritize for culture.
Unproductive Meetings: 35% Waste, $259 Billion Cost
Meeting statistics 2025 deem 35% waste, $259 billion U.S. loss ($37 billion prior), 71% lose weekly to cancels. 67% executive failures, 71% inefficient. You fix: agendas (37% use, cut 80%), clear objectives (72% key).
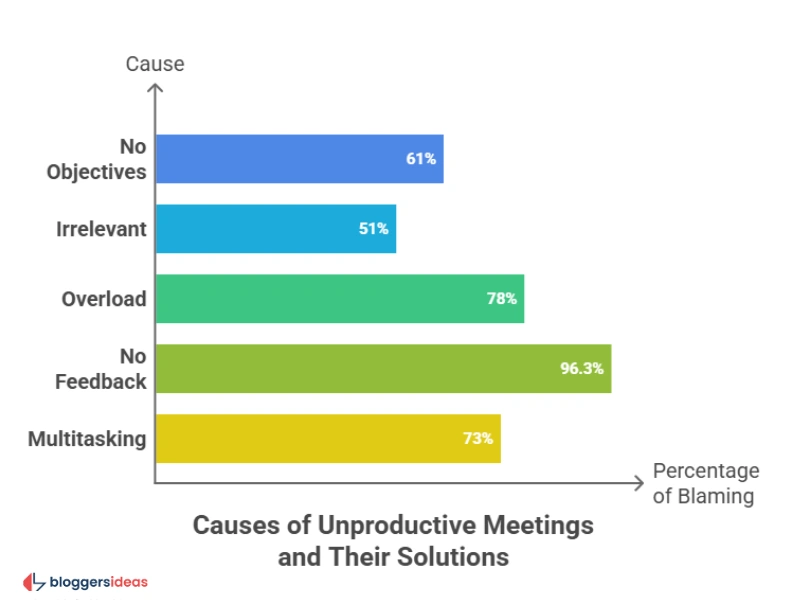
The table lists causes, with fixes—lack objectives 61% C-suite.
| Cause | % Blaming | Solution Impact |
| No Objectives | 61 | 72% productive with |
| Irrelevant | 51 | Invite <8 people |
| Overload | 78 | No-meeting days |
| No Feedback | 96.3 | Collect post; 3.7% always |
| Multitasking | 73 | On-camera; engagement up |
5 hours weekly waste doubled since 2019 (Asana).
Perception and Behaviors: 73% Multitask, 96% Miss
Meeting statistics 2025 note 73% multitask (92% virtual), 91% daydream, 75% lose attention. 96% miss (75% unwilling). You engage: short (52% lose <30 min), inclusive for Gen Z (60% multitask vs. 34% Boomers).
This table behaviors by distraction.
| Behavior/Distraction | % Engaging | Gender/Age Note |
| Small Talk/Gossip | 54 | Top disruption |
| Multitask | 73 | Gen Z 60% always |
| Late/Early Leave | 37 | Tech 33% |
| Shop Online | 35 | Women 40% |
| Read News | 39 | Men 40% |
70% annoy late starts; enforce punctuality.
FAQs About Meeting Statistics
1. How much time do professionals spend in meetings according to meeting statistics 2025?
Professionals average 11.3 hours weekly in meetings, comprising 28% of their workweek, with 83.13% dedicating up to one-third and executives reaching 23 hours, enabling calendar blocking in 58% to safeguard deep work periods.
2. What percentage of meetings are unproductive based on 2025 statistics?
Thirty-five percent of meetings waste time, costing $259 billion annually in the U.S., often from absent agendas in 63% or unclear objectives blamed by 61% of C-suite, remedied by mandating structures to achieve 72% productivity.
3. How have virtual and hybrid meetings evolved in meeting statistics 2025?
Eighty-six percent include remote participants with hybrid at 49% attendance and 64% preference among pandemic remote workers, growing from 48% virtual in 2020 to 77% in 2022, optimized by on-camera for 43% focus or audio-only in 82.9% non-sharing scenarios.
4. What factors contribute to meeting fatigue and how to address them per 2025 data?
Forty-nine percent exhaust from on-camera with women 2.5 times likelier and introverts at 58% versus 40% extroverts, plus 72% tech delays; mitigate via off-camera options, no-meeting days, or short sessions under 30 minutes retaining 52% attention.
5. How can individuals optimize meetings using insights from meeting statistics 2025?
Schedule Tuesdays 9:30 AM-3:30 PM avoiding pre-8 AM for 73%, use agendas in 37% to cut duration 80%, limit to 6-8 attendees, deploy AI transcription at 98.86% accuracy for actions, and block focus time at 58% to counter 11 million daily U.S. overloads.
Also Read:
- Android Usage Statistics
- Coupon Statistics
- Email Marketing Statistics
- Online Advertising Statistics
- Podcast Statistics
Conclusion
Meeting statistics 2025 equip you to master 11.3-hour weeks in 86% hybrid sessions tripling post-2020, countering 35% waste and $259 billion costs by mandating agendas in 37%, scheduling Tuesdays 9:30 AM-3:30 PM to align peaks, or deploying AI like Notta for 98.86% transcripts that capture multilingual insights and action items, slashing follow-ups 80% while boosting decisions to 37%.
Transform perceptions where 73% multitask and 71% lose to cancels: enforce <30-minute focuses retaining 52% attention, no-meeting days reclaiming 5 wasted hours doubled since 2019, or hybrid inclusivity for Gen Z’s 60% multitasking vs. Boomers’ 34%, fostering 68% project advances and 55% productivity gains.
As Reddit champions Wednesday blocks cutting 16% late calls and Quora seeks VR for 34% future adoption, you thrive—block calendars at 58% (67% caregivers), alternate Zoom’s 300 million daily with Google Meet, or async multi-zone 33% to protect deep work, evolving meetings into strategic assets that decide, connect, and propel in a $203 billion industry.