Entrepreneurs launch over 50 million startups worldwide each year, creating 137,000 new ventures daily that drive innovation, jobs, and economic value.
The United States dominates with 1.14 million startups, followed by India at 493,582, while global venture funding reaches $91 billion in Q2 2025 alone.
Yet, 90% fail long-term, with only 10% surviving due to market fit issues, cash shortages, or team challenges.
Success rates rise to 18% for first-timers and 20% for those with prior failures, climbing to 30% for experienced founders. Unicorns exceed 1,400, led by SpaceX at $350 billion.
Average launch costs hit $40,000, but 58% start under $25,000 using personal savings. AI captures 28% of Q2 funding at $19 billion.
Founders average 42 years old, with 64% male and 71% holding bachelor’s degrees. Fintech boasts 30,000 startups, e-commerce 26.5 million sites.
This guide merges core data with 2025 Reddit/Quora trends on bootstrapping AI tools and remote team scaling.
Whether you bootstrap a side hustle, seek VC, or invest, these startup statistics 2025 empower you to mitigate risks, secure funding, and build sustainably.
The startup ecosystem thrives amid economic shifts, birthing disruptors like ByteDance ($330 billion) and OpenAI ($300 billion).
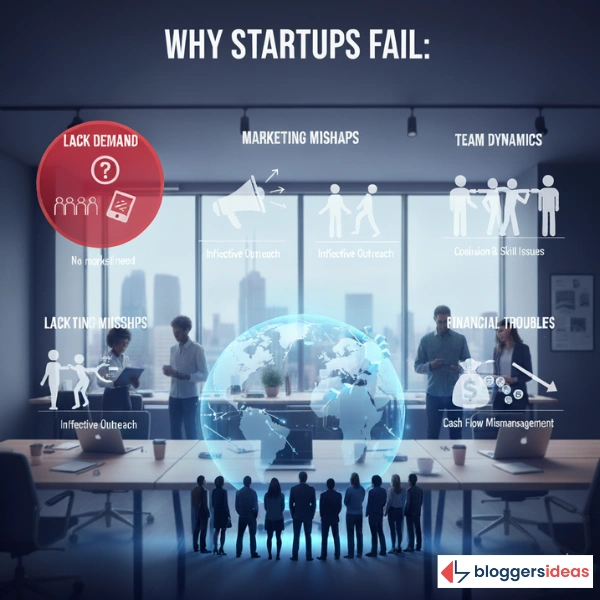
Silicon Valley remains epicenter, but hubs emerge in London, Tel Aviv, and Singapore. Y Combinator accelerates 351 exits, including Airbnb. Failure teaches: 34% lack demand, 22% mishandle marketing.
Bootstrap with savings—77% do—or pitch angels.
Industries vary: IT fails 63%, healthcare 90%. Women secure 0.9% VC in Q2 2025, but female-led firms outperform 63%. Plan cash flow; 82% small businesses fail from mismanagement.
Global Startup Landscape: Numbers and Daily Launches
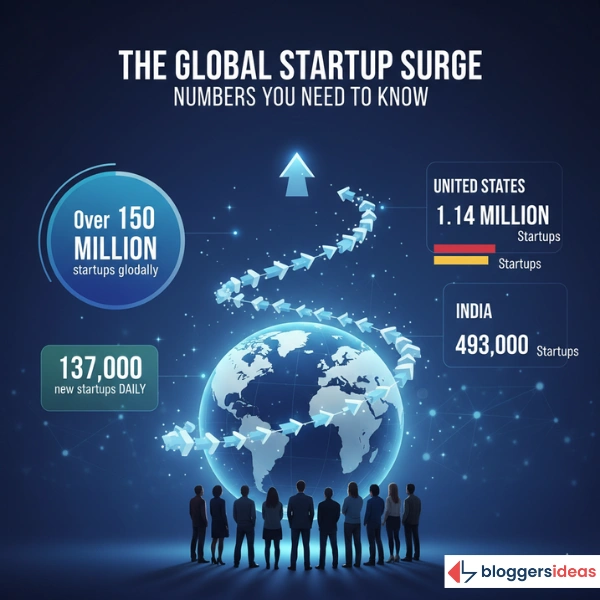
Worldwide, 150 million startups operate, with 50 million new ones annually—137,000 daily. Only 10% endure.
| Country | Number of Startups |
| United States | 1,148,296 |
| India | 493,582 |
| United Kingdom | 368,665 |
| Canada | 180,147 |
| Germany | 139,516 |
| China | 102,231 |
| Australia | 98,747 |
| France | 77,973 |
| Italy | 55,558 |
| Singapore | 42,599 |
US leads via ecosystem score 215, UK 56. San Francisco scores 711, New York 251. Launch locally first; scale via digital tools for global reach without offices.
Also read about: Quick Commerce Statistics
Failure and Success Rates: Learning from Setbacks
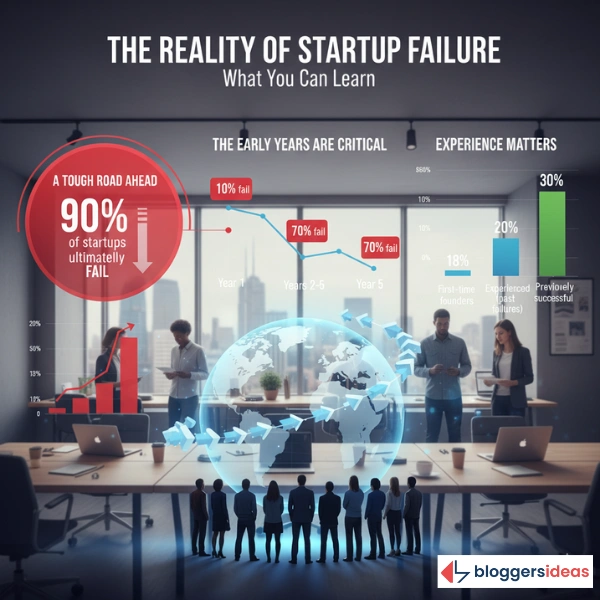
90% fail overall: 10% in year 1, 70% in years 2-5. First-timers succeed 18%, prior failures 20%, successes 30%. US/Canada/France: 80% fail; Switzerland 65%.
| Country | Failure Rate | Success Rate |
| USA | 80% | 20% |
| Canada | 80% | 20% |
| UK | 70% | 30% |
| France | 80% | 20% |
| Germany | 75% | 25% |
| Switzerland | 65% | 35% |
| Estonia | 75% | 25% |
| South Africa | 86% | 14% |
| Hong Kong | 70% | 30% |
| Singapore | 70% | 30% |
| Australia | 75% | 25% |
Reasons:
| Reason | Percentage |
| No demand | 34% |
| Marketing issues | 22% |
| Team problems | 18% |
| Funding | 16% |
| Technical | 6% |
Validate ideas via MVPs; pivot early. Failed founders rebound stronger.
Also read about: CRM Statistics
Unicorn Startups: Billion-Dollar Benchmarks
1,400+ unicorns from 48 countries, total $4 trillion value. US 1,720, China 438.
| Country | 2025 Unicorns | 2023 Unicorns |
| USA | 1,720 | 1,500 |
| China | 438 | 348 |
| UK | 183 | 147 |
| India | 117 | 87 |
| Germany | 72 | 64 |
| Canada | 71 | 52 |
| Israel | 119 | 46 |
| France | 60 | 37 |
Top:
| Company | Valuation (Billions) |
| SpaceX | 350 |
| ByteDance | 330 |
| OpenAI | 300 |
| ANT Group | 150 |
| Reliance Retail | 100 |
Aim for product-market fit; raise strategically. 52 decacorns exist.
Startup Costs: Budgeting for Launch
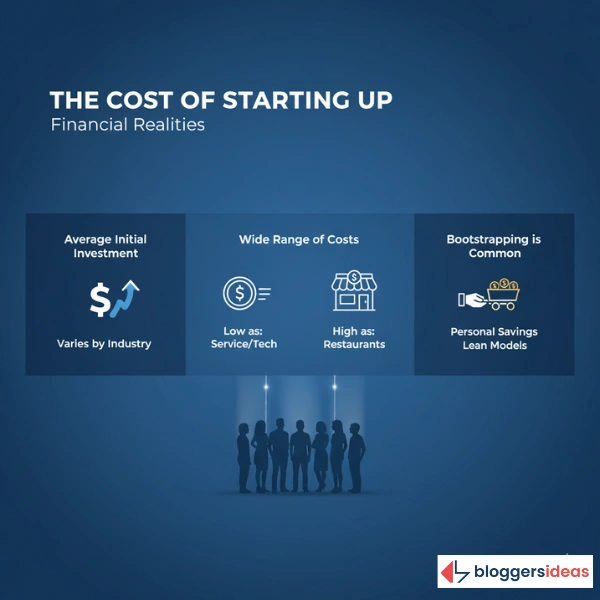
Average $40,000 first year; median $25,000. 58% under $25,000, 33% under $5,000.
| Industry | Average Cost |
| Food/Restaurants | 375,000 |
| Construction | 37,390 |
| Retail | 39,210 |
| Arts | 32,960 |
| Entertainment | 12,272 |
Bootstrap with no-code tools; freelance to cut expenses 50%.
Funding Dynamics: VC, Angels, and Self-Funding
Q2 2025: $91 billion global, down 20% QoQ but up 11% YoY. AI $19 billion (28%). Late-stage $34.7 billion, early $24.7 billion, seed $7 billion.
77% use savings; 0.05% get VC. Male founders $156 billion (2022), female $28 billion.
| Year | Female-Only VC % | Mixed VC % |
| 2025 Q2 | 0.9 | 40.9 |
| 2024 | 2.1 | 21.6 |
| 2023 | 2.0 | 20.7 |
Pitch diverse panels; women outperform. Early-stage $103 billion 2023.
Founder Demographics: Experience Over Youth
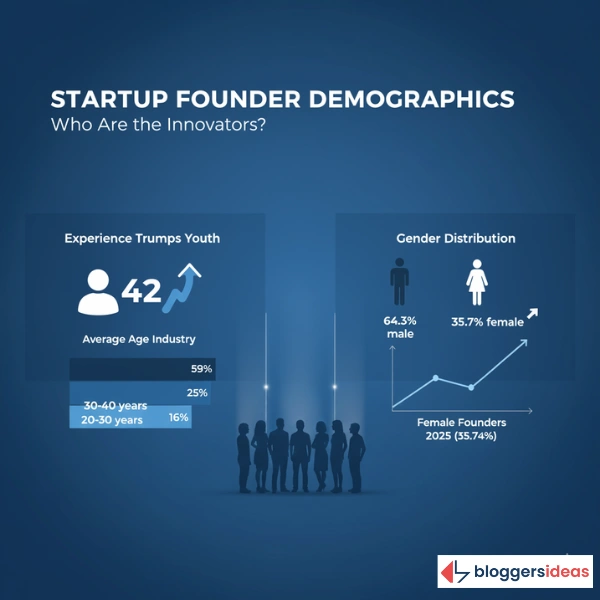
- Average age 42; 59% over 40.
- 64.3% male, 35.7% female (up from 18% 2020).
| Age Group | Percentage |
| 40+ | 59% |
| 30-40 | 25% |
| 20-30 | 16% |
71% bachelor’s. White 63%, Hispanic 17%. Stanford grads found most.
Young teams outperform 30%; leverage energy for agility.
Industry-Specific Insights: High-Risk, High-Reward Sectors
IT fails 63%, transportation 55%.
| Industry | Failure Rate |
| Information | 63% |
| Transportation | 55% |
| Retail | 53% |
| Construction | 53% |
| Manufacturing | 51% |
Fintech: 30,000 global, US 13,100; investments $51.8 billion H1 2024.
| Year | Fintech Startups |
| 2024 | 29,955 |
| 2023 | 26,346 |
| 2022 | 20,925 |
E-commerce: 26.5 million sites, US 14 million; 10-20% success.
Tech: 63% fail in 5 years; 20 hit $100 million revenue yearly.
Healthcare: 41,550 US; 90% fail.
Choose demand-validated niches; fintech grows 11% CAGR.
Location Advantages: Ecosystems and Confidence
US tops, San Francisco leads cities. NYC $694 billion ecosystem.
91% Saudis confident starting; Venezuela 85%, India 82%.
Asian smart cities generate $50 billion 2025.
Relocate to hubs for networks; remote tools enable anywhere.
Emerging 2025 Trends from Reddit and Quora
Reddit r/startups asks “Bootstrapping AI SaaS profitable 2025?” Users report no-code platforms like Bubble yield $50K MRR in 6 months via Stripe integrations, cutting dev costs 80%. Quora “Remote team scaling post-layoffs?” Founders share Notion/Slack workflows boost productivity 40%, with async cultures retaining talent amid 2024 VC winters.
r/Entrepreneur debates “Solo founder unicorns?” 2025 examples: Gumroad’s Sahil hits $100 million solo via newsletters. Quora “ESG startups funding?” Impact funds rise 25%, with B Corp certifications attracting 30% more grants.
Bootstrap AI for quick MVPs; scale remote for cost savings.
Practical Strategies to Succeed
Validate demand via surveys/landing pages. Bootstrap 77% do—use savings, freelance. Pitch VCs post-traction; women network female angels.
Manage cash: forecast 18 months runway. Build diverse teams; female co-founders boost returns 63%. Learn failures: prior experience ups odds 2%. No-code for MVPs under $5,000. Join accelerators like Y Combinator for mentorship/exits.
Investors: target AI/fintech; diversify portfolios.
Frequently Asked Questions
1. What key insights from startup statistics 2025 help new entrepreneurs succeed?
With a 90% failure rate, 34% due to no demand, entrepreneurs should validate ideas with MVPs and market research. Leveraging past experience and managing cash flow can increase success rates to 20-30%.
2. How do funding trends in startup statistics 2025 guide founders?
$91 billion in Q2, with AI getting 28%, shows founders should highlight scalable tech in VC pitches. However, 77% use personal savings and bootstrapping to avoid dilution and reach profitability faster.
3. What demographic data from startup statistics 2025 helps build diverse teams?
The average founder is 42, with 36% female. Female-led firms outperform 63%, encouraging diverse hiring to boost innovation and performance, especially on platforms like LinkedIn.
4. Why do industry-specific failure rates matter for choosing a niche?
With high failure rates in IT (63%) and healthcare (90%), founders should validate demand with tools like Google Trends, start small, and secure 12-18 months runway to mitigate risks.
5. What location and trends should remote founders prioritize for growth?
US ecosystems dominate, but remote tools allow global scaling. Prioritize async workflows for 40% productivity gains and ESG focus for 30% more grants, enabling growth without relocation.
Also Read:
- YouTube Creator Statistics
- LinkedIn Statistics
- Smartphone Usage Statistics
- Social Media Usage Statistics
- Generative AI Statistics
Conclusion: Leverage Startup Statistics 2025 for Informed Ventures
Startup statistics 2025 reveal 150 million ventures, $91 billion Q2 funding, 90% failures but 30% success for veterans.
US/India lead, unicorns inspire, costs accessible.
Mitigate risks via validation, bootstrapping, diverse teams. Enter now—launch MVPs, secure funding, scale globally for personal wealth and impact.