Infographics are becoming essential in digital marketing, with over 65% of marketers using them and a projected increase as demand for visual content rises.
Infographics boost engagement by 650% and inbound links by 178% compared to text-only content. Visuals are processed 60,000 times faster than text, helping 61% of consumers retain information better.
As a result, 84% of companies now consider infographics a crucial part of their marketing strategy. This article explores the latest infographics statistics for 2025, highlighting their impact on engagement, social media, and responsive design.
Are Infographics Still Relevant in 2026? The Unmistakable Answer is a Resounding Yes.
The relevance of infographics in 2025 is not just confirmed but amplified by compelling data points. Infographics are far from a fleeting trend; they are a fundamental component of effective communication.
They possess a unique ability to cut through the noise, delivering impactful messages that resonate with audiences and drive measurable results.
Key Infographic Statistics for 2026: Top Picks
| Statistic | Impact |
| Infographics increase website traffic | Up to 12% increase in website traffic |
| Marketer preference for visual elements | Around 33% of marketers choose infographics |
| Readership likelihood compared to articles | 30 times more likely to be read than a written article |
| Information retention with relevant images | People retain 65% of their information when paired with an image |
| Google search results showing image results | Image results are shown for 27.9% of Google searches |
| Clicks on Google image blocks | Nearly 3% of clicks on Google search results go to image blocks |
| Engagement rate for posts with images | Posts with images have a 650% higher engagement rate |
These statistics paint a clear picture: infographics are not merely relevant; they are essential for achieving higher visibility, better engagement, and superior information retention in the digital age.
Also read about: Google Gemini Statistics
Infographic Usage Statistics for 2026: A Deep Dive into Adoption and Trends
The widespread adoption of infographics by marketers and content creators highlights their perceived value and proven effectiveness. The strategic integration of these visual tools is becoming a standard practice across various industries and platforms.
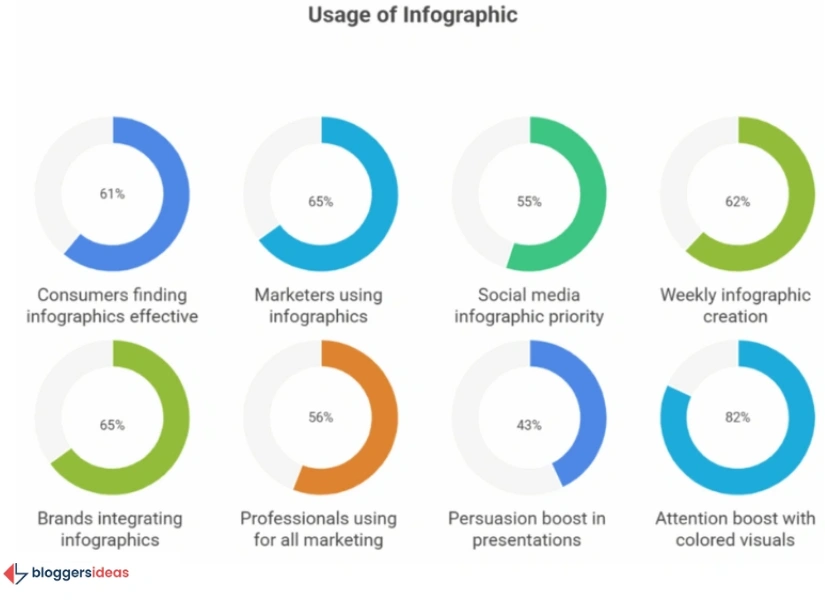
- Consumer Preference for Information Retention: A significant 61% of consumers find infographics to be the most effective method for retaining information. This preference underscores the importance of visual learning and the ability of infographics to simplify complex topics.
- Marketer Adoption in Content Strategy: A substantial 65% of marketers consistently utilize infographics as a core component of their marketing and content strategy. This high rate of adoption demonstrates a clear understanding of the benefits infographics offer in engaging audiences and communicating key messages.
- Speed of Visual Processing: Visual content is processed an astounding 60,000 times quicker than plain text. This rapid processing capability ensures that information conveyed through infographics is absorbed almost instantaneously, maximizing impact in minimal time.
- Dominance in Social Media Visuals: Over half, 55% of marketers, create social media infographics more frequently than any other type of visual media. This trend reflects the effectiveness of infographics in capturing attention and encouraging shares on social platforms.
- Frequency of Creation by Content Creators: A considerable 62% of content creators produce infographics at least twice a week. This consistent output indicates that infographics are not one-off projects but an integral and ongoing part of content production workflows.
- Top Social Media Platforms for Infographics: Instagram and LinkedIn stand out as the top two social media platforms where infographics are most effectively utilized. These platforms, known for their visual emphasis and professional networking respectively, provide fertile ground for infographic engagement.
- Brand Integration into Content Marketing: An impressive 65% of brands seamlessly integrate infographics into their overarching content marketing strategy. This high level of integration speaks volumes about the perceived return on investment (ROI) and strategic value of infographics.
- Professional Usage Across Marketing Purposes: A significant 56% of professionals employ infographics for all their marketing purposes, showcasing the versatility and broad applicability of this visual format across different marketing objectives.
- Enhanced Convincing Power in Presentations: Presentations that incorporate visual aids like infographics are found to be 43% more convincing. This statistic highlights the persuasive power of visuals in conveying arguments and securing audience buy-in.
- Boost in Attention and Comprehension with Color: The strategic use of colored infographics can dramatically boost a reader’s attention span and comprehension by an impressive 82%. Color plays a critical role in making information stand out and improving retention.
- Popularity of Online Creation Tools: Approximately 39.7% of marketers in the United States actively use online tools to create infographics and other forms of visual content. This trend reflects the accessibility and ease of use of various design platforms, democratizing infographic creation.
- Industry Belief in Effectiveness: A commanding 84% of companies firmly believe that infographics marketing is a valuable and highly effective tool. This consensus across the industry reinforces the undeniable impact of infographics.
- Exceptional Engagement Rates: Content posts that feature images and graphics, including infographics, experience a phenomenal 650% higher engagement rate. This metric underscores the unparalleled ability of visuals to captivate audiences and foster interaction.
How People Interact with Infographics: Optimizing for Maximum Impact
Understanding how audiences engage with infographics is crucial for designing campaigns that achieve optimal reach and effectiveness. The way people interact with visual information significantly influences their comprehension and willingness to act.
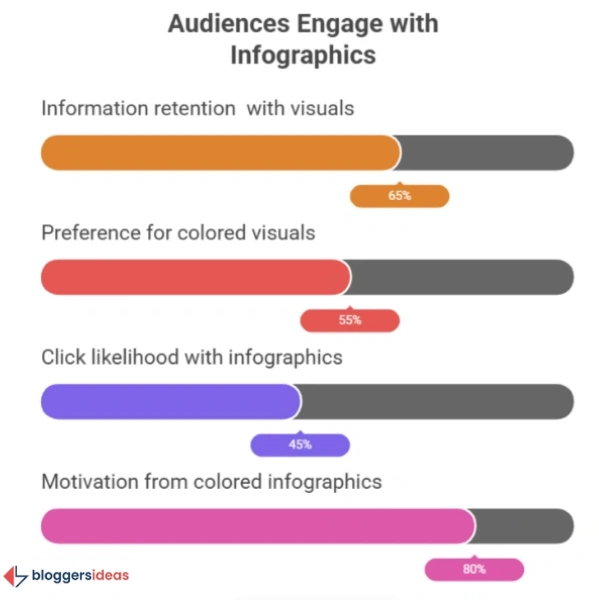
- Superior Information Retention: Readers retain 65% of information when it is effectively paired with a relevant infographic. This highlights the synergy between visual and textual information in enhancing memory and understanding.
- Preference for Color over Black and White: A clear majority, 55% of readers, are more inclined to accept a message presented in color rather than in black and white. Color adds appeal, draws attention, and can convey emotion and hierarchy more effectively.
- Increased Click-Through Rates: Nearly half of online visitors, 45%, are more likely to click on links that prominently feature infographics. This demonstrates the strong allure of visuals in attracting initial interest and driving traffic.
- Visual Prompts for Payments: Users are 30 times more likely to initiate a payment when they are prompted by compelling visuals. This powerful statistic indicates that infographics can be highly effective in driving conversions and desired actions.
- High Motivation Rate with Colored Infographics: Colored infographics boast a very high motivation rate, reaching 80%. This suggests that vibrant and well-designed visuals can inspire action and encourage users to engage more deeply with the content.
- Improved Health Data Comprehension: Patients who receive their health data presented in the form of infographics are 2.84 times more likely to understand their condition better. This demonstrates the critical role of infographics in simplifying complex medical information and empowering informed decision-making.
- Enhanced Content Focus: Half of all users are more focused on content that includes images. This indicates that visuals serve as attention anchors, helping users concentrate on the message being conveyed amidst digital distractions.
- Persuasive Power of Graphical Representation: A study by MIS research revealed that people are 43% more convinced when they encounter a graphical representation of any topic. This underscores the credibility and persuasive impact of data visualized through infographics.
- Value of Brief Yet Detailed Visuals: A significant 67% of users consider visuals that are brief yet detailed to be more valuable than pure text. This highlights the demand for concise, information-rich visual summaries that respect the user’s time.
- Connection Through Content Marketing Campaigns: Approximately 70% of users report that content marketing campaigns, especially those leveraging visuals, help them feel a stronger connection with the company. This emotional connection is vital for building brand loyalty and fostering trust.
Also read about: Video Marketing Statistics
General Infographic Statistics: Broad Impact and Overcoming Challenges
Beyond specific usage patterns, general statistics highlight the overarching impact of infographics and the challenges content creators face in producing them.
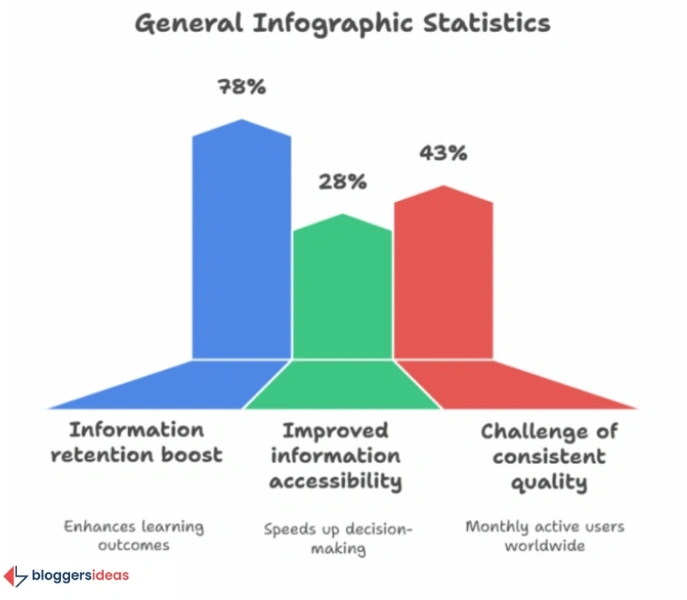
- Enhanced Information Retention: Infographics are responsible for 78% more information retention compared to other content formats. This strong retention rate makes them invaluable for educational and informational purposes.
- Speed of Processing: Infographics can be processed 60 times faster than plain text, affirming their efficiency in conveying information rapidly.
- Improved Information Retrieval: Businesses that regularly use infographics are 28% more likely to find the specific information they need. This suggests that the organized visual structure of infographics aids in quick data retrieval and analysis.
- Budget Allocation for Visual Content: Over 10% of the budget in 65% of businesses is specifically dedicated to visual content, indicating a significant financial commitment to incorporating visuals like infographics into their strategies.
- Hurdles in Consistent Quality Creation: A substantial 43% of marketers identify creating consistent quality visual content as one of the biggest hurdles they face in their roles. This highlights the need for efficient design processes and skilled visual content creators.
- High Click-Through Rates on First Link: Nearly 37% of people click on the first link presented within an infographic. This demonstrates the effectiveness of infographics in guiding user attention and driving specific actions within the visual.
- Massive Increase in Inbound External Links: Incorporating infographics into blogs and articles can lead to a whopping 178% increase in inbound external links. This makes them a powerful tool for SEO and building domain authority.
Social Media Infographic Stats: Amplifying Reach and Engagement
Social media platforms are a natural home for infographics, where their visual appeal and shareability can be fully leveraged to reach vast audiences and drive engagement.
- Superior Shareability: Infographics are shared on social media three times more frequently than other types of content. This viral potential makes them exceptionally effective for brand visibility and audience expansion.
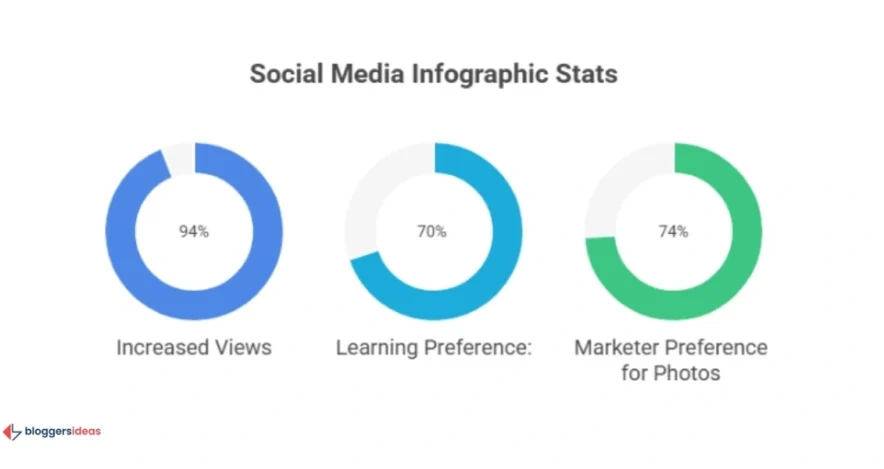
- Increased Views from Shares: This heightened sharing activity results in an impressive 94% extra infographic views, demonstrating a multiplicative effect on reach.
- Preference for Visual Learning on Social Media: A significant 70% of social media users prefer to learn about a topic through infographics rather than through text. This preference aligns with the visual-first nature of many social platforms.
- Doubled Engagement for Facebook Posts with Images: Facebook posts that include images experience twice the engagement rate compared to text-only posts, reinforcing the power of visuals on this platform.
- Increased Shares for Tweets with Visuals: Tweets that incorporate a visual element are 150% more likely to be shared, highlighting the impact of images on Twitter’s fast-paced environment.
- Marketer Preference for Photos in Social Posts: A strong 74% of marketers prefer to include photos in their social media posts, indicating a broad recognition of visual content’s importance.
- Growing Popularity Due to Decreased Attention Spans: The popularity of infographics on social media is steadily growing, largely attributed to the general decrease in users’ attention spans. Infographics provide quick, impactful information bursts.
Optimizing Infographic Sizes for Social Media Platforms:
Ensuring infographics are sized correctly for each social media platform is crucial for optimal display and engagement.
| Platform | Ideal Infographic Size (Pixels) |
| Shared post images: 1200 x 628; Stories: 1,080 x 1,920 (aspect ratio 1.91:1) | |
| Square images: 1,080 x 1,080; Horizontal images: 1,080 x 566; Vertical images: 1,080 x 1,350; Stories: 1,080 x 1,920 | |
| 600 x 900 | |
| 1,104 x 736 | |
| Snapchat | 1,080 x 1,920 |
| Single image or GIF: 1,200 x 675 |
Types of Infographics: Diverse Applications for Diverse Needs
Infographics are not a monolithic content type; they encompass a variety of formats, each suited for different communication objectives. Understanding these types allows for strategic selection based on the message to be conveyed.
The 9 main types of infographics include:
- Process infographics: Illustrating steps in a process or workflow.
- Statistical infographics: Presenting data and numbers in a visually engaging way.
- Informational infographics: Providing a concise overview of a topic.
- Timeline infographics: Displaying events or information in chronological order.
- Geographic infographics: Visualizing data tied to specific locations or regions.
- Comparison infographics: Highlighting similarities and differences between two or more items.
- Hierarchical infographics: Showing levels of organization or importance.
- List infographics: Presenting a series of items in an organized, visual list.
- Resume infographics: A creative visual representation of one’s professional experience and skills.
Responsive Infographic Statistics: Adapting to the Mobile-First World
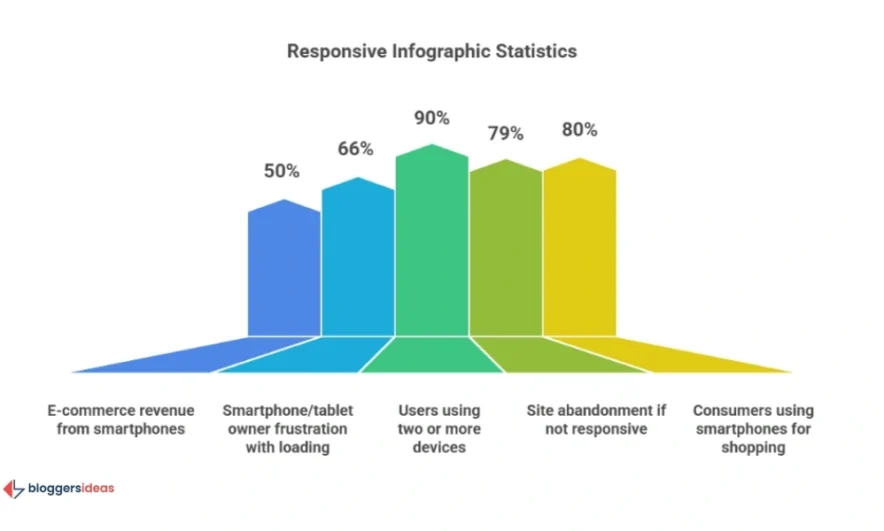
In an era dominated by mobile devices, the responsiveness of content is no longer a luxury but a fundamental requirement. Infographics, like websites, must be designed to adapt seamlessly to various screen sizes to ensure an optimal user experience.
- Mobile-First Revenue Dominance: Half of the total e-commerce revenue now originates from smartphones, a figure that strongly correlates with global eCommerce statistics indicating a pervasive mobile-first shopping behavior. This underscores the critical need for mobile-optimized content.
- Frustration with Loading Times: A significant 66% of smartphone and tablet owners express frustration with slow page loading times. Responsive designs are essential to mitigate this issue and maintain user engagement.
- Diverse Screen Sizes: The market boasts approximately 250 different screen sizes, making a one-size-fits-all approach to content design impractical and ineffective.
- Growing Global Smartphone User Base: With over 6 billion smartphone users worldwide and this number steadily increasing, as reflected in the latest internet user statistics, the imperative for mobile-optimized content is undeniable.
- Simultaneous Multi-Device Usage: A considerable 90% of users regularly utilize two or more devices simultaneously, highlighting the need for a consistent and adaptable content experience across platforms.
- Site Abandonment Due to Non-Responsiveness: A substantial 79% of people will abandon a site if it is not responsive, demonstrating the direct impact of design on user retention and conversion rates.
- Smartphone Shopping Habits: An overwhelming 80% of consumers regularly use their smartphones for shopping, further emphasizing the necessity of responsive design for marketing materials, including infographics.
What Users Are Asking on Quora and Reddit: The Latest Infographic Insights
Beyond the core statistics, online communities like Quora and Reddit offer valuable insights into current user concerns and emerging trends regarding infographics. Users are frequently asking about:
- “How do I make an infographic interactive?” This highlights a growing desire for more dynamic and engaging visual content beyond static images. Marketers are exploring clickable elements, embedded videos, and animated data visualizations within infographics to enhance user experience.
- “What are the best tools for creating AI-powered infographics?” The integration of Artificial Intelligence in content creation is a hot topic. Users are looking for tools that can automate data visualization, suggest design layouts, and even generate infographic content from raw data, streamlining the creation process.
- “Can infographics be effectively used for storytelling, not just data presentation?” This question reflects a shift from purely data-driven infographics to those that weave narratives, creating a deeper emotional connection with the audience. Visual storytelling is gaining traction as a way to make complex information more relatable and memorable.
- “Are there specific accessibility guidelines for infographics for visually impaired users?” As digital inclusivity becomes more important, users are concerned about making their visual content accessible to everyone. This includes using proper alt-text, ensuring sufficient color contrast, and providing text alternatives for screen readers.
- “How do I measure the ROI of my infographic campaigns beyond just shares and likes?” Marketers are looking for more sophisticated metrics to assess the true impact of their infographics, such as lead generation, conversion rates, time spent on page, and direct sales attribution.
These questions reveal a forward-looking perspective, indicating that the future of infographics involves greater interactivity, AI integration, storytelling capabilities, enhanced accessibility, and more granular ROI measurement.
FAQs About Infographics Statistics
1. Why are infographics considered more effective than text-only content for information retention?
Infographics are more effective because the brain processes visuals 60,000 times faster than text, making information easier to understand and remember. Their visual appeal reduces cognitive load, enhancing memory retention.
2. What role does color play in the effectiveness of infographics?
Color enhances infographics by boosting attention and comprehension by 82%. It also makes content 39% more memorable, helps create visual hierarchy, and evokes emotions, driving engagement.
3. How do infographics contribute to a brand's social media strategy in 2025?
Infographics are 3 times more shareable and lead to a 94% increase in views. They provide quick, digestible content, making them ideal for platforms like Instagram and LinkedIn, amplifying brand reach and engagement.
4. Why is responsive design critical for infographics in the current digital landscape?
Responsive design is crucial because over 50% of e-commerce revenue comes from mobile, and 79% of users abandon non-responsive sites. Infographics must adapt to different screen sizes for optimal user experience across all devices.
5. Beyond general engagement, what advanced metrics should marketers consider when evaluating the success of their infographic campaigns?
Marketers should track lead generation, conversion rates, average time on page, bounce rates, and direct sales attribution to better understand the true ROI of infographic campaigns.
Also Read:
- YouTube Statistics
- CRO Statistics
- Instagram Reels Statistics
- Apple Music Statistics
- eLearning Statistics
Infographics as a Driving Force for Enhanced Engagement and Measurable ROI
The comprehensive data presented here unequivocally proves that infographics are a powerful catalyst for improved information retention, significantly stronger engagement, and tangible returns on investment across all digital platforms.
With 65% of marketers now making infographics a central pillar of their content strategy, businesses that embrace this visual tool are experiencing a remarkable 178% surge in inbound links.
Furthermore, social media shares of infographics are tripling compared to traditional text-only content, demonstrating their unparalleled ability to go viral and expand reach.
The numbers speak for themselves. This is further amplified by the critical understanding that 79% of users will abandon non-responsive websites, and a substantial 50% of global e-commerce revenue is now generated through mobile devices. These statistics underscore the absolute necessity of responsive infographic design.
Ignoring this aspect means sacrificing a significant portion of potential engagement and conversions. Infographics are not just about aesthetics; they are a strategic imperative for any brand aiming to thrive in the visually-driven digital ecosystem of 2025 and beyond.
Sources: Forbes, Infographic World