The Unified Payments Interface (UPI) revolutionizes digital transactions in India and beyond, dominating over 80% of all digital payments in the country as UPI market share statistics 2025 reveal its unparalleled growth.
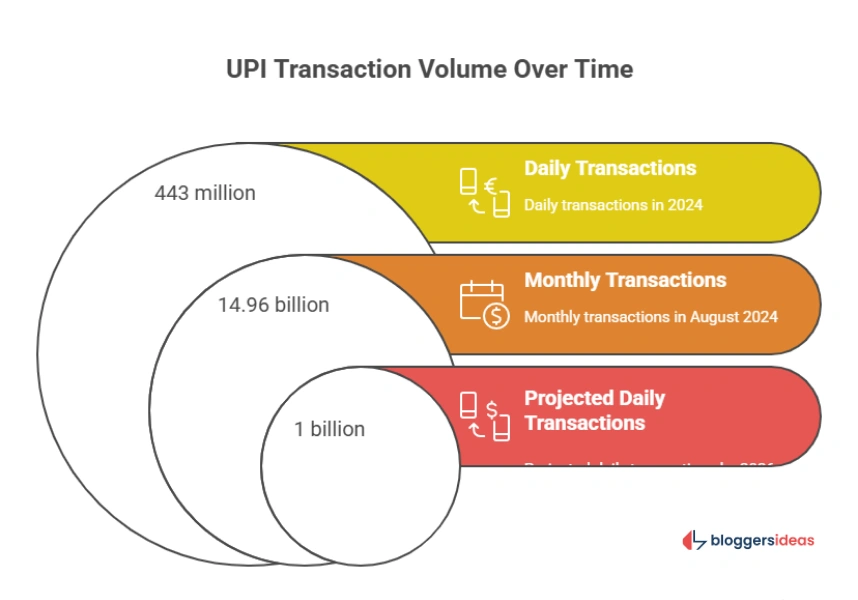
With more than 350 million users in India alone and daily transactions exceeding 443 million, UPI processes an astonishing 14.96 billion transactions monthly, valued at ₹20.60 lakh crore.
This seamless, real-time payment system empowers you as a reader to simplify transfers, boost business efficiency, and embrace cashless convenience.
By delving into these detailed statistics, you discover how UPI’s market leaders like PhonePe (48.3% share) and Google Pay shape the ecosystem, while global expansion to 27 countries opens new opportunities.
Recent Quora discussions highlight users asking about UPI’s integration with international wallets for remittances, and Reddit threads in r/IndiaInvestments seek advice on using UPI for stock investments via apps like Groww.
This article equips you with fresh insights to harness UPI’s power, reduce costs, avoid fraud, and maximize benefits in daily life or business.
General UPI Overview: A Cornerstone of Digital Payments
UPI launches a new era of financial inclusion since its inception on April 11, 2016, by the National Payments Corporation of India (NPCI).
It facilitates instant transfers between bank accounts using mobile devices, requiring no cash or cards.
In 2025, UPI handles over 80% of India’s digital payments, with projections indicating it will contribute 90% of retail digital payments by 2026-2027.
You benefit immensely by adopting UPI, as it offers zero fees for most transactions under ₹2,000, saving money on transfers compared to traditional methods.
The table below summarizes key general UPI statistics for 2025:
| Metric | Statistic |
| Launch Date | April 11, 2016 |
| Daily Transactions | Over 443 million |
| Monthly Transactions | 14.96 billion (August 2024) |
| Total Value (August 2024) | ₹20.60 lakh crore |
| Global Acceptance | 27 countries |
| Projected Daily Transactions by 2026-2027 | 1 billion |
| Success Rate | 99.2% to 99.9% |
These figures demonstrate UPI’s reliability, encouraging you to link multiple bank accounts for seamless switching during high-load periods.
Also read about: PayPal Statistics
UPI User Base: Rapid Adoption Across India
Over 350 million people actively use UPI in India, with estimates reaching 365 million by year’s end. Post-COVID, adoption surges as 93% of Asia-Pacific consumers embrace cashless payments.
Maharashtra leads state-wise usage with 9.92% of volume, followed by Karnataka at 5.39%. You leverage this by registering via apps like PhonePe, enabling quick payments at local vendors and reducing wallet dependency.
The table below details top states by UPI usage in 2025:
| State | Volume (millions) | Volume Contribution (%) | Value (crores) | Value Contribution (%) |
| Maharashtra | 1,985.58 | 9.92% | 2,32,558.18 | 9.36% |
| Karnataka | 1,077.76 | 5.39% | 1,42,488.77 | 5.73% |
| Uttar Pradesh | 1,059.40 | 5.29% | 1,31,586.50 | 5.29% |
| Telangana | 803.98 | 4.02% | 1,22,333.79 | 4.92% |
| Tamil Nadu | 799.24 | 3.99% | 1,18,149.83 | 4.75% |
High penetration in urban areas like these allows you to split bills effortlessly with friends or pay utilities without queues.
Daily and Monthly Transaction Volumes
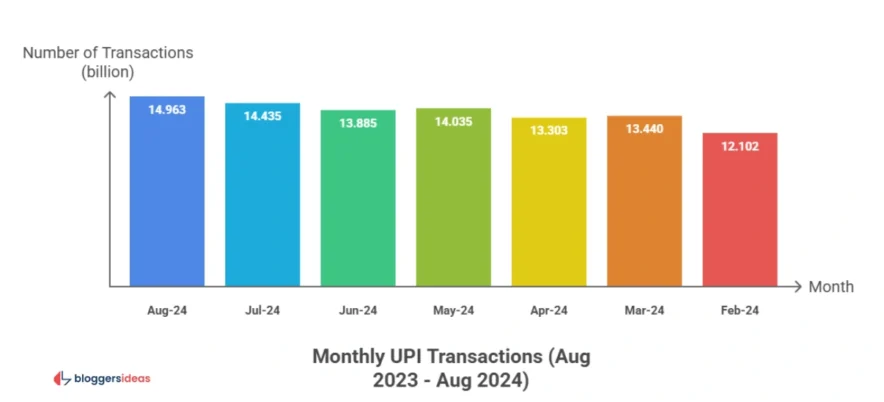
UPI records over 443 million daily transactions, projected to hit 465 million soon. Monthly volumes average 10.07 billion, peaking at 14.963 billion in August 2024.
Person-to-Merchant (P2M) transactions comprise 62.40%, with 86% under ₹500. You optimize daily limits—up to 20 transactions or ₹1 lakh—by planning high-value payments early and using UPI Lite for micro-transactions.
The table below tracks monthly UPI transactions from 2023 to 2024:
| Month | Number of Transactions |
| Aug-24 | 14.963 billion |
| Jul-24 | 14.435 billion |
| Jun-24 | 13.885 billion |
| May-24 | 14.035 billion |
| Apr-24 | 13.303 billion |
| Mar-24 | 13.440 billion |
| Feb-24 | 12.102 billion |
| Jan-24 | 12.203 billion |
| Dec-23 | 12.020 billion |
| Nov-23 | 11.235 billion |
| Oct-23 | 11.408 billion |
| Sep-23 | 10.555 billion |
| Aug-23 | 10.586 billion |
| Jul-23 | 9.964 billion |
| Jun-23 | 9.335 billion |
This growth, up 36% year-over-year, signals you to integrate UPI in e-commerce for faster checkouts and higher conversions.
Transaction Limits and Values: Practical Guidelines
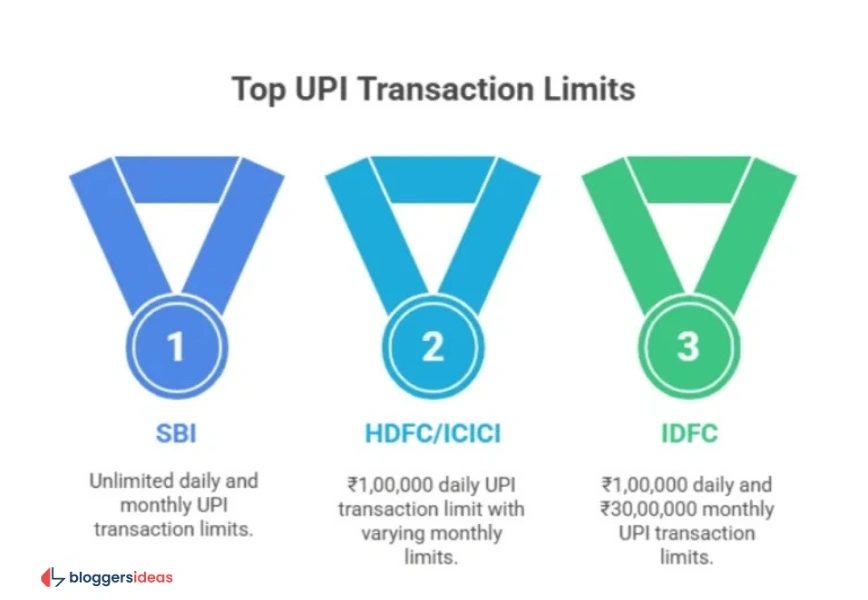
Users conduct up to 20 UPI transactions daily, with most banks capping at ₹1 lakh. Monthly limits vary, like IDFC’s ₹30 lakh.
Average ticket size stands at ₹1,528, with P2P at ₹2,836 and P2M at ₹643. You manage budgets by tracking via app notifications, avoiding limits during travel or shopping sprees.
The table below lists UPI limits for popular banks:
| Bank Name | Daily Limit | Monthly Limit |
| Bank of Baroda | ₹25,000 | Varies |
| HDFC | ₹1,00,000 | Varies |
| ICICI Bank | ₹1,00,000 | Varies |
| IDBI Bank | ₹1,00,000 | Varies |
| IDFC | ₹1,00,000 | ₹30,00,000 |
| India Post Payment Bank | ₹25,000 | Varies |
| Kotak Mahindra Bank | ₹1,00,000 | Varies |
| Punjab National Bank | ₹25,000 | Varies |
Understanding these helps you choose banks for higher limits in business scenarios.
Global Expansion: UPI Beyond Borders
UPI operates in 27 countries, including France, Singapore, UAE, and Sri Lanka, with 10 more in talks. NPCI signs MoUs for cross-border linkages, enabling remittances.
You travel worry-free by using UPI in Bhutan or Nepal for local payments, saving on forex fees.
The table below lists countries accepting UPI:
| Country | Status |
| India | Native |
| Singapore | Accepted |
| South Korea | Accepted |
| Armenia | Accepted |
| Thailand | Accepted |
| Bahrain | Accepted |
| Bhutan | Accepted |
| Cambodia | Accepted |
| Maldives | Accepted |
| Nepal | Accepted |
| Vietnam | Accepted |
| United Arab Emirates | Accepted |
| France | Accepted |
| Sri Lanka | Accepted |
| Australia | Accepted |
| Qatar | Accepted |
| Indonesia | Accepted |
| Japan | Accepted |
| Saudi Arabia | Accepted |
| Oman | Accepted |
| Switzerland | Accepted |
| Malaysia | Accepted |
| Mauritius | Accepted |
| Canada | Accepted |
| United Kingdom | Accepted |
| European Union | Accepted |
| Russia | Accepted |
This expansion benefits NRIs sending money home instantly at low costs.
UPI Lite: Simplifying Small Payments
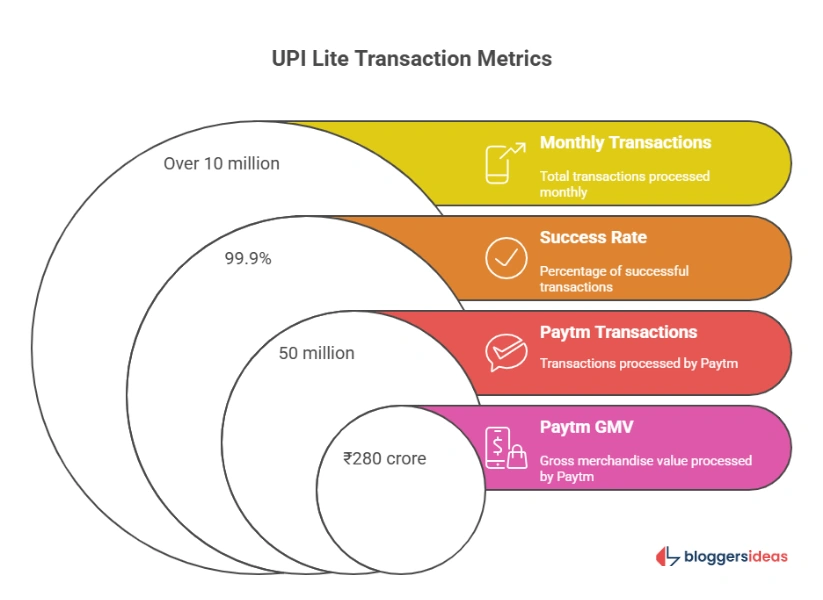
UPI Lite processes over 10 million monthly transactions, with a 99.9% success rate. Limits rise to ₹500 per transaction, no PIN required.
Paytm leads with 63% of QR payments via Lite. You use it for daily chai or auto rides, avoiding main UPI overload during peaks.
The table below shows UPI Lite growth:
| Metric | Statistic |
| Monthly Transactions | Over 10 million |
| Success Rate | 99.9% |
| Paytm GMV | ₹280 crore |
| Paytm Transactions | 50 million |
Incorporate Lite for offline merchants, enhancing rural adoption.
Bank-Wise Market Share: Leaders in Volume
State Bank of India (SBI) dominates with 4.05 billion average monthly transactions, followed by HDFC at 1.27 billion. 684 banks go live on UPI. You select SBI-linked apps for reliability in high-volume areas.
The table below ranks top banks by transactions:
| Bank Name | Average Transactions (millions) |
| State Bank of India | 4,052 |
| HDFC Bank Ltd | 1,270 |
| Bank of Baroda | 985 |
| Union Bank of India | 941 |
| Punjab National Bank | 835 |
| Kotak Mahindra Bank | 772 |
| Axis Bank Ltd | 730 |
| Canara Bank | 722 |
| ICICI Bank | 648 |
| Bank of India | 478 |
Businesses partner with top banks for robust remittance.
App-Wise Market Share: Dominance of Top Players
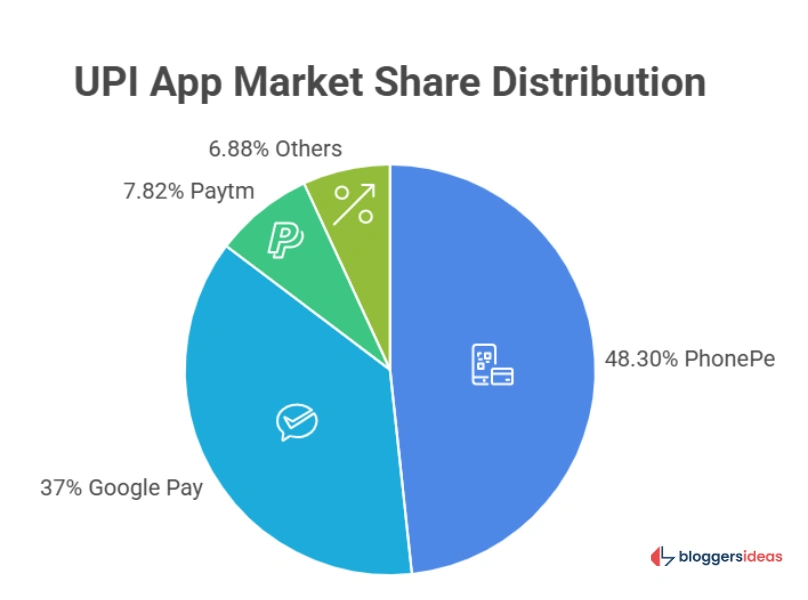
PhonePe holds 48.3% market share, processing 9.15 billion transactions, followed by Google Pay at 37% (7.06 billion) and Paytm at 7.82%. Together, they handle 95% of value.
You download PhonePe for rewards and widespread merchant acceptance.
The table below details UPI app market shares:
| App | Market Share |
| PhonePe | 48.3% |
| Google Pay | 37% |
| Paytm | 7.82% |
| Others | 6.88% |
Switch apps based on cashbacks to maximize savings.
PhonePe Specifics: Market Leader Insights
PhonePe boasts 500 million registered users, digitizing 36 million merchants across 99% pin codes. Revenue hits ₹2,914 crore in FY2023, up 77%. You earn cashbacks on recharges, boosting loyalty.
The table below shows PhonePe growth:
| Metric | FY2023 |
| Revenue | ₹2,914 crore |
| Users | 500 million |
| Merchants | 36 million |
Use for investments via integrated mutual funds.
Google Pay Specifics: Global and Local Reach
Google Pay serves 150 million users in 19 countries, with 67 million in India. 2,193 companies adopt it. 83% Indians use it in stores. You scan QRs abroad, avoiding currency hassles.
The table below compares Google Pay usage:
| Country | In-Store (%) | Online (%) |
| India | 83% | 79% |
| United States | 37% | 32% |
| Poland | 34% | 39% |
| Finland | 32% | 29% |
| Germany | 31% | 16% |
Ideal for international travelers.
Paytm Specifics: Steady Growth Amid Competition
Paytm averages 89 million monthly transacting users in FY2023, up 36%. Revenue from payments: ₹4,930 crore.
Transactions via bank: 407.65 million in June 2023. You diversify with Paytm for wallet top-ups.
The table below tracks Paytm payment revenue:
| FY | Revenue (crore) |
| 2023 | 4,930 |
| 2022 | 3,432 |
| 2021 | 1,981 |
BHIM App: Government-Backed Alternative
BHIM records 22.9 million monthly transactions in June 2023, value ₹72.59 billion. Available in 13 languages. You choose BHIM for direct government subsidies.
The table below shows BHIM monthly volumes:
| Month | Transactions (millions) |
| June 2023 | 22.9 |
| May 2023 | 22.8 |
| April 2023 | 23.61 |
Fraud Statistics: Staying Safe
95,402 UPI fraud cases report in FY2023, up from prior years. 50% financial frauds link to UPI/internet banking. You enable biometric locks and avoid sharing OTPs.
The table below outlines fraud trends:
| Year | Cases |
| FY2023 | 95,402 |
| 2021-22 | 84,274 |
| 2020-21 | 77,299 |
Additional Insights: Patterns and Tips
₹1,000 tops common transfer amounts. 37% transactions post-6 PM. Four UPI IDs per account possible. Spending rises 35% Monday.
Recent Reddit users ask about UPI for crypto; advise against due to regulations. Quora queries on UPI Circle for delegated payments—use for family allowances.
Strategies to Benefit from UPI
Link UPI to savings for investments. Merchants accept via QR for 1.1% fee over ₹2,000. Track via apps to budget. Use internationally for remittances.
FAQs About UPI Statistics
1. What is the current market share of leading UPI apps in 2025?
PhonePe leads with 48.3% market share, processing over 9.15 billion transactions monthly, followed by Google Pay at 37% and Paytm at 7.82%, together handling 95% of UPI value.
2. How many countries accept UPI payments in 2025?
UPI operates in 27 countries including France, Singapore, UAE, and Sri Lanka, with 10 more in pipeline, allowing you seamless cross-border transfers.
3. What are the daily and monthly UPI transaction limits?
Users conduct up to 20 transactions daily with most banks capping at ₹1 lakh, while monthly limits vary like IDFC’s ₹30 lakh, helping you plan large payments.
4. How can businesses benefit from UPI's growth in 2025?
Businesses integrate UPI for 99.2% success rates, low fees, and P2M dominance at 62.40%, boosting sales via QR codes and reducing cash handling.
5. What fraud prevention measures should UPI users take in 2025?
Users enable biometrics, avoid OTP sharing, and monitor transactions, as 95,402 fraud cases reported in FY2023, ensuring secure usage amid rising volumes.
Also Read:
- WhatsApp Statistics
- Zoom Statistics
- Meta AI Statistics
- Video Marketing Statistics
- Apple Music Statistics
Conclusion
UPI market share statistics 2025 showcase a system with 48.3% PhonePe lead, 350+ million users, and global reach, enabling you to transact efficiently, save costs, and grow financially in a cashless world.