In 2025, YouTube continues to stand as an undisputed titan of the digital world, profoundly influencing how we consume information, entertainment, and connect with communities.
More than just a video-sharing platform, it serves as a global stage for creators, a powerful marketing channel for businesses, and a rich source of knowledge for billions.
This in-depth article will meticulously explore the most up-to-date YouTube statistics for 2025, covering its massive user base, intricate demographics, diverse usage patterns, impressive revenue streams, and its enduring position in the social media hierarchy.
We will uncover how individuals and businesses can leverage these insights to their benefit, integrating fresh perspectives from user discussions on platforms like Quora and Reddit to provide a truly comprehensive guide to YouTube’s immense potential.
YouTube’s Unrivaled Reach: A Global Phenomenon in 2026
YouTube’s user base in 2025 is nothing short of staggering, cementing its status as one of the most impactful digital platforms globally. The platform proudly boasts over 2.53 billion monthly active users (MAU), a testament to its pervasive influence across diverse cultures and demographics.
This represents a substantial increase from 2 billion users in 2019, showcasing continuous and robust growth. On a daily basis, YouTube engages approximately 122 million active users, highlighting its integral role in the daily routines of a significant portion of the global internet population.
The platform’s reach extends to nearly half of all internet users worldwide, with approximately 46% visiting YouTube at least once a month. This widespread adoption means that YouTube’s user base accounts for about 30.86% of the global population, underscoring its unparalleled penetration. The trajectory of YouTube’s monthly active users over recent years vividly illustrates its consistent expansion:
| Year | YouTube MAU (Monthly Active Users) |
| 2025 | 2.53 billion |
| 2024 | 2.50 billion |
| 2023 | 2.70 billion |
| 2022 | 2.68 billion |
| 2021 | 2.5 billion |
| 2020 | 2.3 billion |
| 2019 | 2 billion |
| 2018 | 1.8 billion |
| 2017 | 1.6 billion |
| 2016 | 1.5 billion |
Source: Statista
These figures not only confirm YouTube’s dominance but also signal a continued upward trend in its global footprint, making it an indispensable platform for anyone seeking to reach a broad audience.
The Premium Experience: YouTube Premium and YouTube TV in 2025

Beyond its free, ad-supported model, YouTube offers premium services that cater to specific user preferences, further diversifying its revenue streams and enhancing user experience. As of 2025, YouTube Premium has garnered over 125 million active subscribers globally.
This ad-free version of YouTube, which also includes access to YouTube Music, has seen remarkable growth since its rebranding from YouTube Red in 2018.
The subscriber count dramatically crossed the 100 million mark in February 2024, demonstrating a strong appetite for an uninterrupted viewing experience and exclusive content.
The growth of YouTube Premium subscribers over the years underscores its increasing appeal:
| Year | Number Of YouTube Premium Subscribers |
| 2025 | 125 million |
| 2024 | 100 million |
| 2022 | 80 million |
| 2021 | 50 million |
| 2020 | 30 million |
| 2019 | 18 million |
| 2018 | 10 million |
| 2017 | 2.8 million |
| 2016 | 3 million |
| 2015 | 1.5 million |
Source: Business Of Apps
In the realm of live television streaming, YouTube TV has also carved out a significant niche, particularly in the United States, where it boasts 9.4 million subscribers.
It has emerged as the most subscribed virtual multichannel video programming distributor (vMVPD) service in the nation, reflecting a broader shift in how consumers access and enjoy television content.
Here is a table displaying the most subscribed vMVPD services in the United States:
| vMVPD Service | Number Of Subscribers |
| YouTube TV | 7.9 million |
| Hulu + Live TV | 4.4 million |
| Sling TV | 2 million |
| Fubo | 1.5 million |
These premium offerings highlight YouTube’s strategic expansion beyond traditional video sharing, providing diverse options that cater to varying consumer demands and solidifying its market position.
Also read about: Social Media Statistics
Understanding the YouTube Audience: Demographics and Global Footprint

YouTube’s success is largely attributable to its broad appeal, attracting internet users across virtually all age groups and genders. Its vast variety of content ensures that there is something for everyone, creating a truly diverse audience.
In terms of age demographics, the largest segment of YouTube users, accounting for 39.5%, falls within the 25- to 44-year-old range.
This demographic is often highly engaged and possesses significant purchasing power, making it a valuable target for advertisers and creators.
Users aged 18 to 24 constitute 15.8% of the platform’s audience, while a substantial 19.4% of YouTube users are aged 55 or older, demonstrating the platform’s reach across multiple generations.
Here is a table displaying the distribution of YouTube users by age group:
| Age Group | Share of YouTube Users |
| 18 to 24 | 15.8% |
| 25 to 34 | 21.7% |
| 35 to 44 | 18.5% |
| 45 to 54 | 14% |
| 55-64 | 9.9% |
| 65+ | 9.5% |
Regarding gender demographics, YouTube’s worldwide user base is slightly male-dominated, with men accounting for 54.3% of users and women making up 45.7%.
However, this trend reverses in the United States, where female users constitute 51.2% of the YouTube audience, while males represent 48.8%. This regional variation highlights the nuanced nature of global internet usage and content preferences.
Here is a table displaying the share of male and female YouTube users worldwide and in the United States:
| YouTube Users By Gender | Worldwide | United States |
| Male | 54.3% | 48.8% |
| Female | 45.7% | 51.2% |
Geographically, India leads the world with the highest number of YouTube users, boasting approximately 491 million active users.
The United States follows with a significant 253 million users, securing the second position. Brazil (144 million) and Indonesia (143 million) round out the top four, underscoring YouTube’s strong presence in populous, emerging digital markets.
Here is a table displaying the countries with the highest number of YouTube users worldwide:
| Country | Number Of YouTube Users |
| India | 491 million |
| United States | 253 million |
| Brazil | 144 million |
| Indonesia | 143 million |
| Mexico | 83.6 million |
| Japan | 78.7 million |
| Germany | 65.5 million |
| Vietnam | 62.3 million |
| Philippines | 57.7 million |
| Turkey | 57.5 million |
It is also important to acknowledge that YouTube faces restrictions in several countries, including China (excluding Hong Kong and Macau), Eritrea, Iran, North Korea, Turkmenistan, and South Sudan, due to various governmental regulations and policies.
These bans indicate the complex geopolitical landscape in which a global platform like YouTube operates.
Also read about: WhatsApp Statistics
YouTube’s Financial Powerhouse: Revenue Statistics in 2026
YouTube’s financial performance in 2025 continues to be exceptionally strong, driven primarily by its robust advertising revenue. The platform recorded an impressive $36.1 billion in revenue by the end of 2024, representing a substantial 14.6% increase from the previous year. This growth highlights the platform’s enduring appeal to advertisers seeking to reach its massive and engaged audience.
Breaking down the 2024 revenue, YouTube generated $8.09 billion in the first quarter, which steadily increased to $8.66 billion in Q2 and further to $8.92 billion in Q3. The fourth quarter of 2024 marked a record-breaking period, with YouTube generating an astounding $10.47 billion in quarterly revenue, reflecting peak advertising spending during the holiday season.
Looking back, YouTube achieved an annual revenue of $31.5 billion in 2023, representing a healthy 7.88% increase from the $29.2 billion reported in 2022. The consistent upward trend in revenue over the past decade underscores YouTube’s economic significance within the digital ecosystem.
Here is a table displaying the revenue generated by YouTube through ads over the past years:
| Year | Revenue |
| 2024 | $36.1 billion |
| 2023 | $31.5 billion |
| 2022 | $29.24 billion |
| 2021 | $28.8 billion |
| 2020 | $19.7 billion |
| 2019 | $15.1 billion |
| 2018 | $11.1 billion |
| 2017 | $8.1 billion |
| 2016 | $6.7 billion |
| 2015 | $5.5 billion |
| 2014 | $4.2 billion |
| 2013 | $3.1 billion |
| 2012 | $1.7 billion |
| 2011 | $1.3 billion |
| 2010 | $800 million |
In terms of in-app purchase (IAP) revenue, the United States consistently contributes the largest share, generating a substantial $53.82 million in December 2024.
Japan follows with $16.9 million, and South Korea ranks third with $7.85 million. These figures indicate significant consumer spending within the app, further solidifying YouTube’s diverse revenue streams.
Here is a table displaying the YouTube In-app purchases recorded in December 2024 in different countries worldwide:
| Country | Youtube IAP Revenue |
| United States | $53.82 million |
| Japan | $16.9 million |
| South Korea | $7.85 million |
| Mexico | $3.94 million |
| Brazil | $3.86 million |
| United Kingdom | $3.85 million |
| Australia | $3.27 million |
| Canada | $2.83 million |
| Germany | $2.59 million |
| Taiwan | $2.4 million |
These robust financial statistics underscore YouTube’s pivotal role in the global digital economy and its continued ability to generate substantial revenue through advertising and premium services.
YouTube’s Position in the Social Media Landscape: A Second Place Giant
While often viewed primarily as a video platform, YouTube’s interactive features, comment sections, and community engagement firmly establish it as a social media powerhouse.
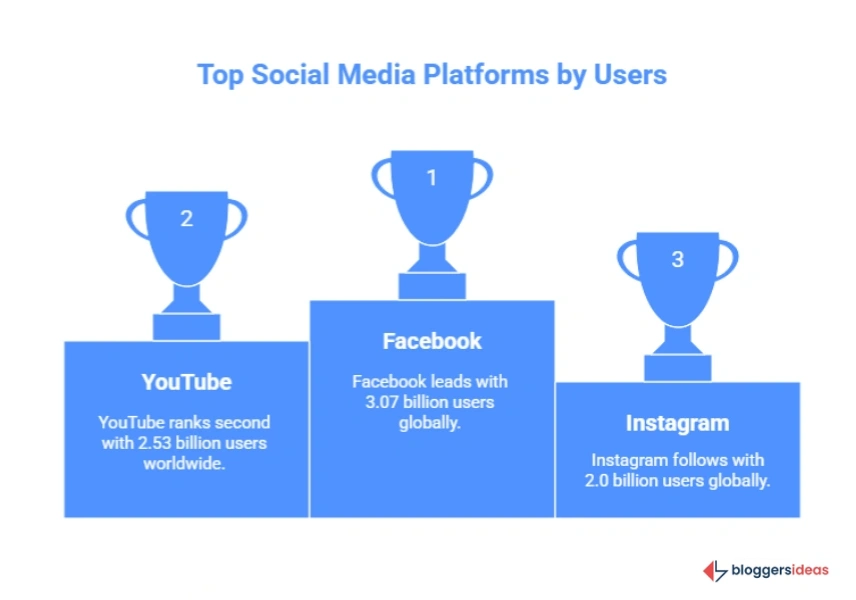
In 2025, YouTube proudly holds its position as the second-largest social media platform globally, boasting over 2.53 billion active users. Only Facebook, with 3.07 billion users, surpasses YouTube in terms of sheer user volume.
Considering that there are 5.17 billion active social media users worldwide, YouTube’s user base accounts for an impressive 48.35% of all active social media users, highlighting its pervasive presence in the digital lives of billions.
Here is a table displaying YouTube’s rank among different social media platforms according to the number of platform users:
| Social Media Platform | Number of Users |
| 3.07 billion | |
| Youtube | 2.53 billion |
| 2.0 billion | |
| 2.0 billion | |
| TikTok | 1.58 billion |
| 1.34 billion | |
| Facebook Messenger | 1.01 billion |
| Telegram | 900 million |
| Snapchat | 850 million |
| Douyin | 755 million |
| Kuaishou | 700 million |
| Twitter (X) | 611 million |
| 598 million | |
| 554 million | |
| 498 million |
This strong second-place ranking reinforces YouTube’s importance not only as a content consumption platform but also as a crucial channel for social interaction, community building, and information dissemination.
Time Spent on YouTube: Deep Engagement and Sustained Attention
User engagement metrics are vital indicators of a platform’s stickiness and value. YouTube excels in this regard, with users spending a significant amount of time on the platform daily. In 2024, users spent an average of 48 minutes and 42 seconds on YouTube each day.
This represents an increase of 1 minute and 12 seconds compared to 2023 (47 minutes and 30 seconds) and a substantial 9-minute increase since 2019 (39 minutes and 42 seconds). This consistent growth in watch time highlights YouTube’s ability to retain user attention and provide compelling content.
Here is a table displaying the average time that users spend on YouTube daily, as recorded over the years:
| Year | Average Time Spent Daily on YouTube |
| 2024 | 48 minutes and 42 seconds |
| 2023 | 47 minutes and 30 seconds |
| 2022 | 46 minutes and 12 seconds |
| 2021 | 45 minutes |
| 2020 | 43 minutes and 42 seconds |
| 2019 | 39 minutes and 42 seconds |
Furthermore, YouTube boasts the highest average session duration compared to other social media platforms, with users spending an average of 7 minutes and 37 seconds in a single session.
This prolonged engagement per session is a significant advantage for creators and advertisers, allowing for deeper content consumption and message delivery. For context, TikTok, known for its short-form content, has the second-highest session duration at 5 minutes and 52 seconds, while Facebook trails with 3 minutes and 44 seconds.
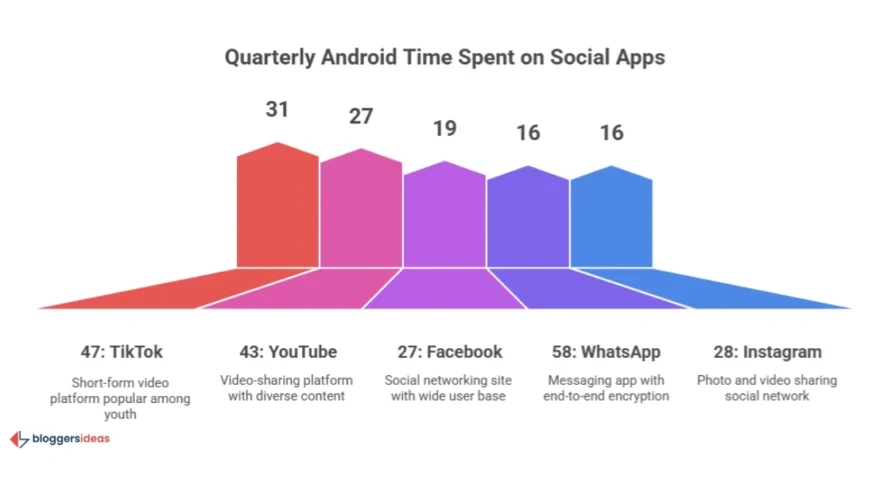
When looking specifically at mobile usage, an active user spent an average of 27 hours and 43 minutes on YouTube’s Android app between October 1st and December 31st, 2023.
While TikTok’s active users spend the most time on its Android app (31 hours 47 minutes), YouTube still secures the second position, indicating robust mobile engagement.
Here is a table displaying the time spent by users on the Android apps of various social media platforms between October 1st and December 31st, 2023:
| Social Media Android App | Hours Spent on Android Apps |
| TikTok | 31 hours 47 minutes |
| YouTube | 27 hours 43 minutes |
| 19 hours 27 minutes | |
| 16 hours and 58 minutes | |
| 16 hours and 28 minutes | |
| Line | 8 hours and 04 minutes |
| X (Twitter) | 5 hours and 19 minutes |
These statistics collectively highlight YouTube’s exceptional ability to capture and retain user attention across various devices, making it a powerful platform for sustained content consumption and interaction.
Top Creators and Content Trends: Shaping the YouTube Ecosystem
YouTube’s ecosystem is continuously shaped by its top creators, who attract massive audiences and generate significant engagement.
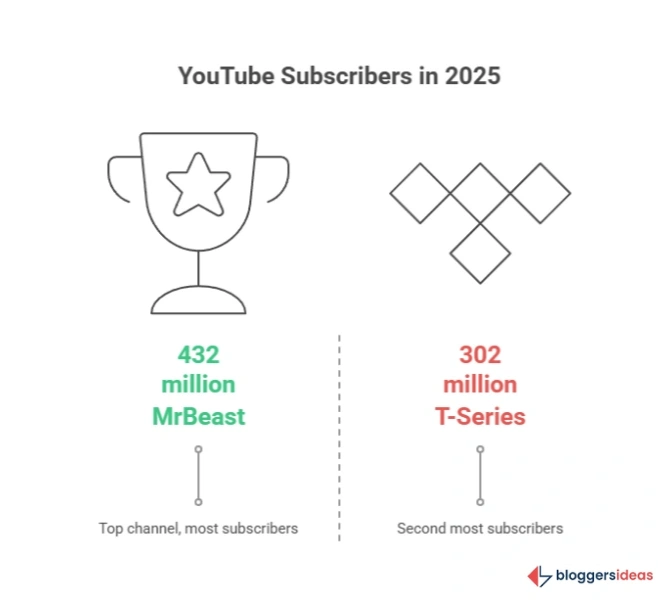
MrBeast (Jimmy Donaldson) holds the title of the YouTube channel with the most subscribers, boasting an impressive 432 million in his main account. He also stands as YouTube’s top earner, pulling in an estimated $700 million in the last year, demonstrating the immense financial potential for successful creators.
T-Series, a major Indian music label, follows closely with 302 million subscribers and consistently ranks as the most-viewed YouTube channel worldwide, accumulating over 3 billion views in the last 30 days.
Other top channels include Cocomelon – Nursery Rhymes (197 million subscribers) and SET India (186 million subscribers), highlighting the diverse content types that thrive on the platform.
Here is a table displaying the YouTube Channels with the highest number of YouTube Subscribers:
| Channel Name | Number of YouTube Subscribers |
| MrBeast | 432 million |
| T-Series | 302 million |
| Cocomelon – Nursery Rhymes | 197 million |
| SET India | 186 million |
| Vlad and Niki | 145 million |
| Kids Diana Show | 136 million |
| Stokes Twins | 131 million |
| Like Nastya | 130 million |
| Zee Music Company | 120 million |
| Kimpro | 119 million |
The platform also continues to innovate with formats like YouTube Shorts, which has garnered 2 billion monthly active users and over 5 trillion views so far. These short-form videos cater to a growing demand for quick, engaging content, allowing creators to reach new audiences and complement their long-form offerings.
Content trends also reveal specific areas of growth. For instance, videos directed towards “beginners” saw a 50% increase in popularity during the 2020 quarantine, indicating a sustained desire for educational and entry-level content.
This trend suggests a significant opportunity for businesses and educators to create foundational content in their areas of expertise.
YouTube for Business and Marketing: A Powerful Growth Engine
For businesses and marketers, YouTube represents an incredibly potent channel for brand awareness, engagement, and conversions. Its status as the second-largest search engine, right behind Google, underscores its importance for discoverability. Users frequently turn directly to YouTube to search for videos on specific topics, making video optimization for search crucial for visibility.
The platform is widely adopted by marketers, with 54% currently using YouTube, and an even higher 59% planning to increase their use of YouTube videos.
This growing commitment from the marketing community reflects the platform’s demonstrated effectiveness. A significant 87% of viewers have made a purchase after seeing a brand on YouTube, highlighting its direct impact on consumer behavior and its efficiency in driving conversions for products and services.
Targeting strategies on YouTube greatly influence ad performance. Ads targeted by intent achieve a 100% higher lift in purchase intent compared to those based solely on demographics.
Intent-targeted ads are also less likely to be skipped, resulting in higher overall views and engagement. Among ad formats, pre-roll skippable ads are considered the most effective by 29% of respondents in a survey, while non-skippable ads are less favored.
For content creation, YouTube statistics suggest an ideal video length between 7 and 15 minutes to maximize viewer retention, though experimentation remains key to finding what resonates best with specific audiences.
Only 9% of small businesses in the United States currently use YouTube for their video marketing strategy, representing a massive untapped market, especially with the increasing ease of video production through generative AI tools.
However, 30% of YouTubers struggle with audience engagement, highlighting the need for strategic planning around posting times, SEO, and relevant hashtags.
YouTube Safety and Community: Addressing Concerns
Maintaining a safe and positive environment is a continuous challenge for a platform of YouTube’s scale. In response to flagged videos, approximately 34% of removed content is due to child safety concerns, underscoring YouTube’s commitment to protecting its youngest users.
An additional 5% of flagged videos are removed for containing spam or misleading content, and around 8% are deleted due to cyberbullying and harassment.
Here is a table showing the top reasons for the removal of YouTube videos:
| Reason For Removal | Share of Flagged Videos |
| Child Safety | 34% |
| Harmful Or Dangerous | 17.1% |
| Violent or Graphic | 16.4% |
| Nudity or Sexual | 12.1% |
| Harassment and Cyberbullying | 8.3% |
| Spam, Misleading and Scams | 4.6% |
| Hateful or Abusive | 3.8% |
| Promotion of Violence and Violence Extremism | 1.3% |
| Other | 0.5% |
These statistics demonstrate YouTube’s ongoing efforts to enforce its community guidelines and ensure a safer browsing experience for all its users.
Emerging Trends and User Questions from Online Forums
Discussions on platforms like Quora and Reddit reveal deeper insights into current user concerns and emerging trends related to YouTube:
- Monetization for Smaller Creators: Many users ask about alternative monetization strategies beyond traditional AdSense, especially for channels that haven’t reached the partner program thresholds. This includes discussions on crowdfunding, memberships, and direct product sales.
- Algorithm Transparency: There’s a constant quest for understanding how the YouTube algorithm works, with creators and marketers frequently asking for tips to increase discoverability and watch time. They question whether engagement signals like comments and likes still hold as much weight as watch duration.
- YouTube Shorts Monetization and Strategy: A common query revolves around how to effectively leverage YouTube Shorts for growth and monetization, and how its algorithm differs from long-form video.
- Cross-Platform Content Strategy: Users are exploring how to repurpose content across YouTube, TikTok, Instagram Reels, and other platforms efficiently, asking for best practices for optimizing video for each platform’s unique audience and format.
- Mental Health for Creators: There’s a growing conversation about the pressures of content creation, burnout, and maintaining authenticity while chasing views and subscribers, especially for independent creators.
- The Rise of AI in Content Creation: Users are discussing how AI tools can assist with scriptwriting, video editing, translation, and even generating video ideas, exploring the ethical implications and practical benefits.
- Live Streaming and Interactive Content: Questions about effective strategies for live streaming, audience interaction during live events, and integrating interactive elements into videos are becoming more frequent.
These discussions highlight a community actively trying to optimize their presence, adapt to platform changes, and find innovative ways to succeed in YouTube’s evolving landscape.
FAQs About YouTube Statistics
1. How many people actively use YouTube in 2025, and what are its key usage statistics?
In 2025, YouTube has over 2.53 billion monthly and 122 million daily active users worldwide. Users spend an average of 48 minutes daily, with sessions lasting about 7.5 minutes, showing strong engagement with video content.
2. What are the main demographic characteristics of YouTube’s global audience?
YouTube’s largest demographic is users aged 25-44, making up 39.5% of its audience. Globally, 54.3% of users are male, and 45.7% are female, with females slightly outnumbering males in the U.S. India has the highest number of users (491 million), followed by the U.S. (253 million).
3. How much revenue did YouTube generate in 2024, and what are its primary revenue streams?
In 2024, YouTube generated $36.1 billion in revenue, a 14.6% increase from the previous year. Its primary revenue sources are advertising and subscriptions to services like YouTube Premium and YouTube TV.
4. How does YouTube rank among other social media platforms, and what is its role as a search engine?
YouTube is the second-largest social media platform globally, after Facebook, and the second-largest search engine after Google. It plays a key role in content discovery and information seeking through video.
5. What opportunities does YouTube offer for businesses and creators in 2025, and what challenges do they face?
In 2025, YouTube helps businesses boost brand awareness and sales, with 87% of viewers purchasing after seeing a brand. Creators can build large audiences and earn significantly, but face challenges in engagement, algorithm optimization, and adapting to platform changes.
Also Read:
- Tinder Statistics
- Microsoft Teams Statistics
- Instagram Reels Statistics
- Apple Music Statistics
- Digital Marketing Statistics
Conclusion: YouTube – An Evolving Ecosystem of Opportunity in 2026
As of 2025, YouTube’s influence is more pervasive than ever. With over 2.53 billion monthly active users, 122 million daily active users, and a dedicated base of 125 million YouTube Premium subscribers, it stands as a dominant force deeply integrated into global internet usage. Its robust financial performance, evidenced by $36.1 billion in revenue in 2024, underscores its economic power.
The platform’s diverse user base, led by India with 491 million users, confirms its global appeal and cultural significance. Consistently securing its position as the second-largest social media platform, YouTube continues to adapt and innovate, addressing the evolving needs of its ever-expanding global audience.
For creators, marketers, and businesses, YouTube presents an unparalleled opportunity to connect, engage, and convert.
Understanding these statistics and actively adapting strategies to current trends, including the growing demand for short-form content, the nuances of algorithmic discovery, and the power of intent-based advertising, is crucial for maximizing success on this dynamic platform.
Looking ahead, YouTube’s trajectory suggests continued growth and an even deeper integration into the fabric of digital life, making it a non-negotiable component of any comprehensive digital strategy.