Hey there! Let’s chat about social media in 2025—it’s everywhere, right? Whether you’re scrolling through Instagram, watching YouTube, or chatting on WhatsApp, social media is a big part of our lives.
We’re talking how many people use it, which apps are hot, and what’s new this year. Ready to jump into the social media statistics of 2025?
Let’s go!
Social Media: Our Daily Buddy
Social media’s like that friend who’s always around—helping us stay connected, find cool stuff, or just have a laugh.
In 2025, it’s bigger than ever, and people all over the world are hooked! From Mumbai to New York, we’re tapping away on our phones. So, how big is it? Let’s dive into some numbers that’ll make your jaw drop!
How Many People Use Social Media?
First things first—how many of us are on social media? A lot! Here’s what the stats say:
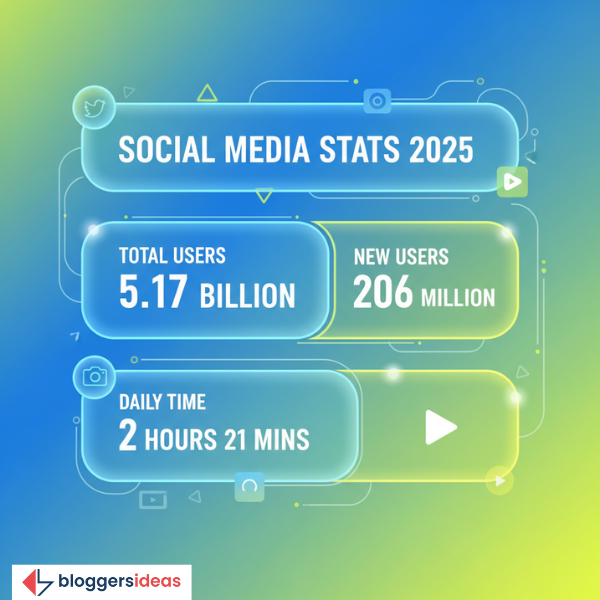
- Total Users: Around 5.17 billion people use social media in 2025 (DataReportal, Feb 2025). That’s more than half the world—63.9% of everyone (Smart Insights)!
- New Friends: Last year, 206 million new users joined the party (Sprout Social). That’s like adding almost all of India’s WhatsApp crowd in one go!
- Daily Time: We spend about 2 hours and 21 minutes a day scrolling (DataReportal). That’s like watching a Bollywood movie every day!
Here’s a quick table to see it clearly:
| What | Number |
| Total Users | 5.17 billion |
| New Users (2024-25) | 206 million |
| Daily Time | 2 hours 21 mins |
So, if you’re on Instagram right now, you’re one of billions doing the same thing—cool, huh?
Who’s on Social Media?
Okay, who’s behind all these likes and shares? Let’s break it down:
- Internet Users: 94.8% of people online use social media (Smart Insights). That’s almost everyone with Wi-Fi!
- Men vs. Women: It’s pretty even—slightly more guys (like 52%) than girls (DataReportal), but both love it!
- Young Crowd: Over 50% of users are 18-34 years old (Sprout Social). Older folks (55+) are just 16%—guess who’s ruling the reels?
And here’s a fun bit:
- Kids and Teens: In places like the UK, apps like Reddit and Discord are big with Gen Z (Smart Insights). Gaming’s a huge reason!
Also read about: Best Social Media Proxies: Top Picks for Automation & Privacy
Which Apps Are the Stars?
Not all social media apps are the same—some are super popular! Here’s the top list for 2025:
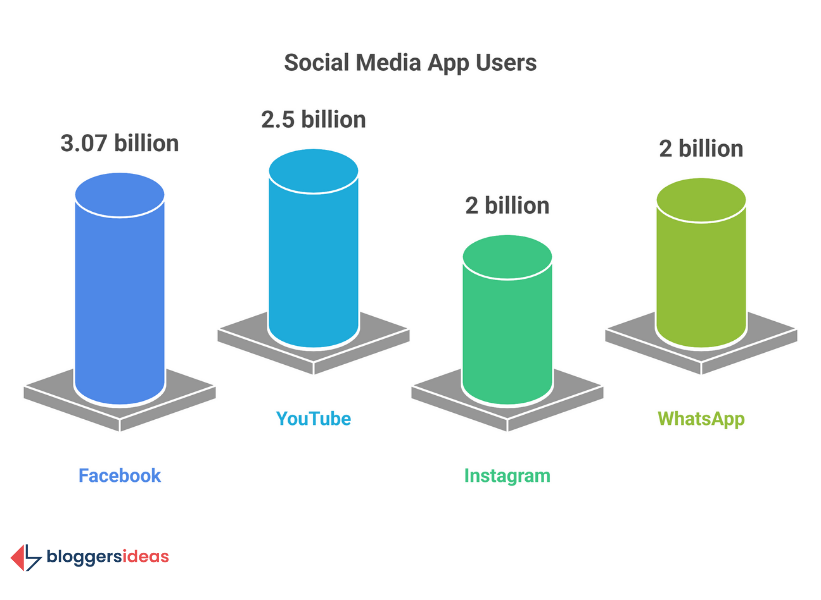
- Facebook: Still #1 with 3.07 billion monthly users (Sprout Social). That’s like everyone in India and the US combined!
- YouTube: 2.5 billion users—people love videos (DataReportal).
- Instagram: Tied with WhatsApp at 2 billion users each (Smart Insights).
- TikTok: 1.6 billion users—dancing and fun keep it hot (Sprout Social).
Here’s a table of the big players:
| App | Monthly Users |
| 3.07 billion | |
| YouTube | 2.5 billion |
| 2 billion | |
| 2 billion | |
| TikTok | 1.6 billion |
| Telegram | 900 million |
| X (Twitter) | 611 million |
| 498 million |
Source: Statista
Facebook’s still the boss, but TikTok’s zooming up fast—especially with the young crowd!
Also read about: Best YouTube Proxies: The Top Options for Privacy & Speed
Phones vs. Computers: Where We Scroll
In India, we’re always on our phones, right? Same goes worldwide! Here’s how we use social media:
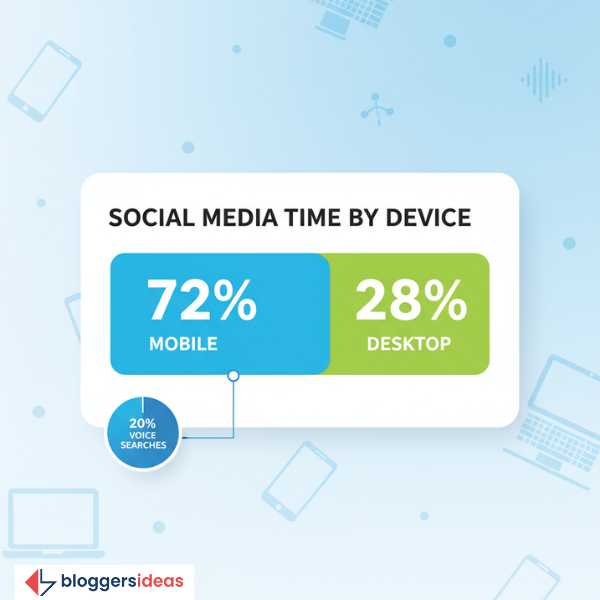
- Mobile Wins: 72% of time on social media is on phones (Smart Insights). Tablets and computers get just 28% (Sprout Social).
- Voice Fun: 20% of phone searches are by talking—like “Hey, show me funny videos” (DataReportal).
- Busy Fingers: We check apps 6.6 times a day on average (Sprout Social).
Here’s a table to see it:
| Device | Time Spent |
| Mobile | 72% |
| Desktop | 28% |
| Voice Searches | 20% of mobile |
Source: StatCounter
Phones are our go-to—quick, easy, and always with us!
How Big Is Social Media Compared to Others?
Social media apps fight to be #1, but Google’s still king of search. How does social stack up?
- Market Share: Social media isn’t search, but Facebook’s reach beats most (Smart Insights). It’s got 86% of marketers using it (Sprout Social).
- Instagram’s Close: 79% of marketers love Instagram too (Sprout Social).
- Small Fry: Apps like Snapchat or Pinterest are way behind—less than 20% marketer use (Smart Insights).
Social’s not Google, but it’s a giant in its own world!
What Do We Do on Social Media?
Why are we all hooked? Here’s what we’re up to:
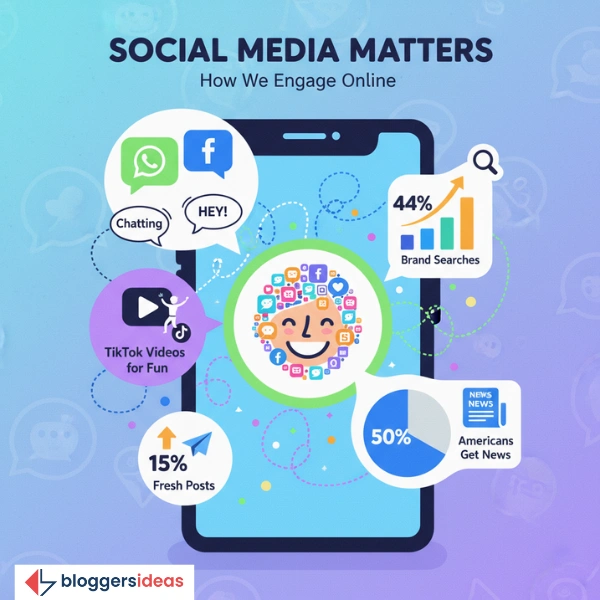
- Chatting: Messaging friends is big on WhatsApp and Facebook (DataReportal).
- Laughing: TikTok’s all about fun videos—people want entertainment (Sprout Social).
- Shopping: 44% look for brands like “Adidas shoes” (Smart Insights).
- News: 50% of Americans get news from social media sometimes (DataReportal).
And guess what?
- New Ideas: 15% of posts are totally fresh—stuff nobody’s asked before (Sprout Social).
Videos and More: Cool Ways to Use Social
Social’s not just typing—it’s getting creative!
- Short Videos: 80% of people love quick clips under 30 seconds (Sprout Social). Think Reels or TikToks!
- Long Videos: YouTube’s still king for longer stuff—93% of marketers use video (Smart Insights).
- Live Fun: 46% watch live streams—like concerts or chats (DataReportal).
It’s like a movie theater in your pocket!
Do We Click or Just Look?
Here’s something funny—not every scroll ends with a tap:
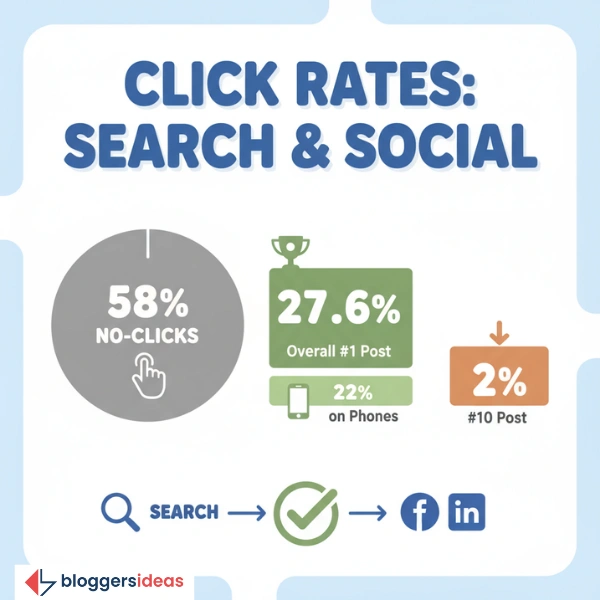
- No Clicks: 58% of searches don’t get clicks—people just read and leave (Smart Insights).
- Top Spot: The #1 post gets 27.6% of clicks (Sprout Social). By #10, it’s just 2% (DataReportal).
- Phone vs. PC: Phones see fewer clicks—22% for #1 (Smart Insights).
Here’s a click table:
| Position | Click Rate (Phone) | Click Rate (PC) |
| #1 | 22% | 27.6% |
| #2 | 13% | Higher than phone |
| #10 | 2% | Tiny! |
Being at the top is like winning a prize—everyone sees you!
Money, Money, Money!
Social media isn’t just fun—it’s big business!
- Ad Cash: Brands will spend $276.7 billion on social ads in 2025 (Sprout Social). That’s a lot of rupees!
- Big Returns: Every $1 on ads brings $8 back (Smart Insights). Shops love that!
- Visits: Facebook alone gets 84 billion visits a month (DataReportal).
Social’s like a gold mine for companies!
Fun Social Media Facts for [year]
Let’s toss in some extra cool bits:
- Time Saved: Social apps save us 200 years of typing daily with autofill (Smart Insights). Lazy but smart!
- Nearby Stuff: 46% of searches are local—like “best dosa near me” (Sprout Social).
- News Love: 10% of adults prefer social for news (DataReportal).
And here’s a wild one:
- Boom Start: Back in 2011, Snapchat kicked off with disappearing pics—now it’s huge (Smart Insights)!
AI and Social: What’s Hot?
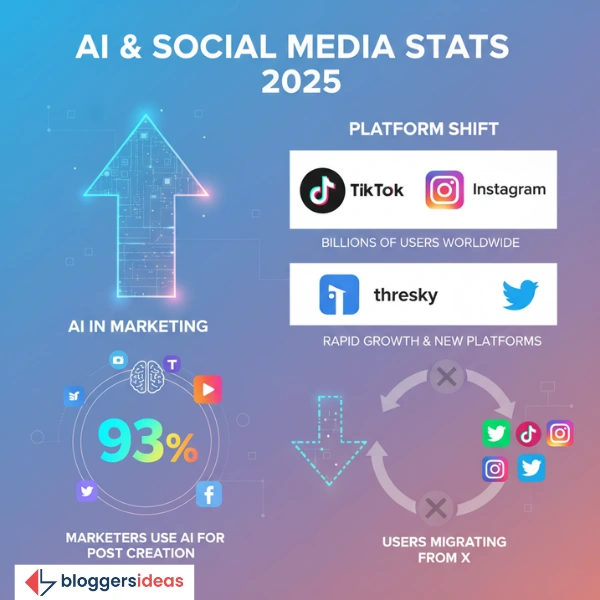
AI’s the big buzzword in 2025, but social’s still rocking it!
- AI Help: 93% of marketers use AI for posts—like making videos fast (Sprout Social).
- Social Wins: TikTok and Instagram beat AI apps with billions of users (DataReportal).
- New Tools: Threads and Bluesky are growing—people switching from X (Smart Insights).
Social’s like, “AI’s cool, but we’re cooler!”
Why Social Matters to You
So, why care about all this? Here’s the deal:
- Stay Connected: Chat with friends or family anywhere (DataReportal).
- Find Stuff: Look up shops or ideas—like “best phones 2025” (Sprout Social).
- Have Fun: Watch videos or share memes—it’s a blast (Smart Insights)!
For shops, it’s a way to say “hi” to customers and sell stuff!
FAQs About Social Media Statistics
1. How many people use social media in 2025?
In 2025, about 5.17 billion people use social media—around 63.9% of the global population! That’s more than half the world scrolling, liking, and sharing daily.
2. Which social media app has the most users in 2025?
Facebook still leads with 3.07 billion monthly users, followed by YouTube (2.5 billion), Instagram (2 billion), and WhatsApp (2 billion). TikTok is close behind with 1.6 billion users.
3. How much time do people spend on social media daily in 2025?
On average, people spend about 2 hours and 21 minutes per day on social media—roughly the length of a Bollywood movie every single day!
4. Do people mostly use social media on mobile or desktop in 2025?
Mobile dominates, with 72% of social media time spent on smartphones and tablets. Only 28% comes from desktops or laptops.
5. Is social media still important for businesses in 2025?
Definitely! Brands are expected to spend $276.7 billion on social media ads in 2025. Every $1 spent brings back around $8 in return, making it a key tool for business growth.
Also Read:
Wrapping It Up
Social media in 2025 is massive—5.17 billion users, 3 billion on Facebook, and $276 billion in ads! It’s where we laugh, shop, and chat, all in 2 hours and 21 minutes a day.
From phones to videos, it’s growing fast, even with AI trying to steal the show. It’s like a big party everyone’s invited to—and it’s not stopping! Which app’s your favorite? Tell me below—I’d love to know!