Okay, confession time: I almost didn’t write this because I got lost scrolling Instagram—again! I’m not alone, though. With over 2.4 billion people hooked worldwide, Instagram’s got us all in its grip.
It’s not just a social app anymore—it’s a vibe, a marketplace, and a creativity hub rolled into one. From hilarious memes to jaw-dropping fashion finds, it’s where trends are born and wallets open.
But what’s the secret sauce keeping Instagram on top in 2025? Let’s dive into some wild stats and a fresh angle: Instagram’s not just about engagement—it’s rewriting how we connect, shop, and dream.
With Reels stealing the show and AI spicing things up, here’s why Instagram’s still the app we can’t quit—and 47 surprising numbers to prove it!
Why Instagram’s Still the Cool Kid in 2026
I’ve been thinking: Instagram isn’t just winning at likes and comments—it’s turning into our digital playground. Sure, the algorithm’s a genius, showing us stuff we didn’t even know we wanted.
But it’s more than that. It’s the rush of a disappearing Story, the thrill of a Reel gone viral, or the ease of snagging that cute jacket mid-scroll.
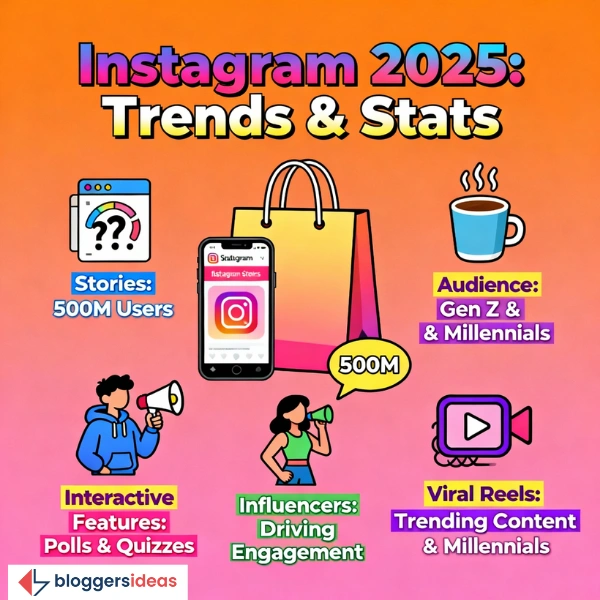
For the young crowd—Gen Z and Millennials—it’s their space to chat, create, and flex. Brands and influencers are in on it too, dropping polls, hosting live Q&As, and sparking challenges that keep us tapping. Here’s what’s fueling the fire:
- Shopping Without the Hassle: Instagram Shopping lets you spot a product and buy it without ever leaving the app. It’s like a mall in your pocket—sales are soaring because it’s so darn easy.
- Stories That Hook: With 500 million daily users, Stories vanish in 24 hours, making us rush to watch. It’s personal, urgent, and oh-so-addictive.
- Playtime with Features: Polls, quizzes, and sliders turn passive scrolling into a game. I’ve caught myself voting on a friend’s outfit just because it’s fun!
- Influencers Rule: From makeup gurus to fitness buffs, influencers drive trends and trust. Their posts feel like a friend’s advice, not an ad.
- Reels Revolution: Short, snappy videos are taking over—think TikTok vibes with Instagram flair. They’re quick, catchy, and everywhere.
Now, let’s get to the juicy part: the latest stats, hot off the press for 2025, with a twist on how Instagram’s shaping our lives beyond just likes.
- Also read about: How To Scrape Instagram 2025 Your Ultimate Guide
Instagram Stats You’ll Wish You Knew Sooner
Here are the freshest numbers for 2025, pulled from the latest reports (like Measure Studio and Hootsuite’s 2025 Social Media Trends), plus some brand-new surprises from my digging. I’ve tossed in a table or two to keep it neat!
The Big Picture
| Stat | Number | What It Means |
| Monthly Active Users (MAUs) | 2.42 billion | Instagram’s bigger than ever—more folks than live in China and India combined! |
| Global Market Share | 10.2% | It’s eating up the social media pie, outpacing rivals. |
| Annual User Growth | 5.4% | Up from 5% last year—259 million newbies joined in 2024 alone! |
| Daily Active Users (DAUs) | 500 million+ | Half a billion people check in every day—wild, right? |
| Time Spent Daily | 33 minutes | We’re glued to it longer than a sitcom episode! |
Source: Statista
Who’s Scrolling?
- 72% of users are under 34—Gen Z and Millennials rule the app.
- 85% of US Gen Z (16-25) use Instagram daily—practically their digital oxygen.
- India leads with 400 million+ users, then the US (169.6 million), and Brazil (134.6 million). It’s a global party!
- 50.8% male, 49.2% female—a near-even split, unlike the old days.
Engagement Vibes
| Stat | Number | What It Means |
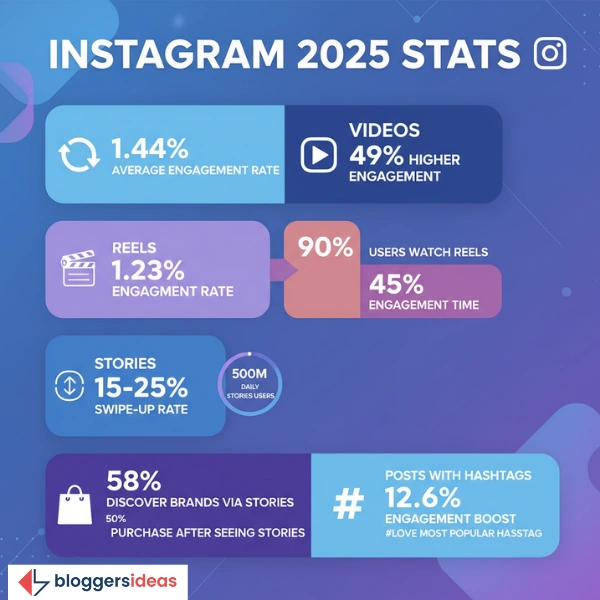
| Average Engagement Rate | 1.44% | Down 28% from last year—tougher to grab attention now! |
| Video vs. Photo Engagement | 49% higher | Videos are winning hearts over still pics. |
| Reels Engagement Rate | 1.23% | The king of content—short and sweet rules! |
| Stories Swipe-Up Rate (Business) | 15-25% | A quarter of viewers click through—sales goldmine! |
| Posts with Hashtags | 12.6% boost | #Love (2.15 billion uses) still reigns supreme. |
- 90% of users watch Reels daily—short videos are the new scroll-stoppers.
- Reels snag 45% of total engagement time—we’re hooked on 15-second hits.
- 500 million use Stories daily—FOMO keeps us tapping those circles.
- 58% of folks get curious about brands via Stories—more than half!
- 50% visit a site to buy after seeing a Story—impulse shopping, anyone?
Also read about: Best Instagram Proxies Provider
Shopping Spree
- Instagram Shopping rakes in $40 billion for global e-commerce—huge cash flow!
- 70% of shoppers hunt for their next buy on Instagram—it’s the new mall.
- 130 million click shopping posts monthly—retail therapy’s gone digital.
- 25% of ads push shopping—brands know where the money’s at.
- 75% use AR shopping features—trying on virtual lipstick is a game-changer.
Influencers & Brands
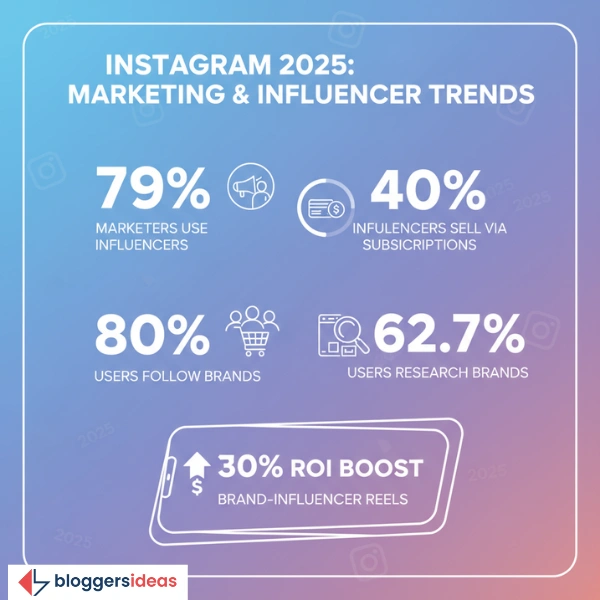
- 79% of marketers call Instagram a must for influencer campaigns—it’s the hotspot.
- 40% of influencers sell exclusive stuff via subscriptions—think VIP Reels!
- 80% of users follow a business—brands are part of the fam.
- 62.7% research brands on Instagram—more than anywhere else.
- Brands teaming with influencers on Reels see 30% ROI boost—collabs pay off big.
Tech Twist
- 60%+ of creators use AI editing tools—think auto-enhanced Reels and pics.
- 5 million+ NFTs listed—Instagram’s now an art gallery too!
- 98% access via mobile—no surprise, it’s our phone’s BFF.
- 50% of Explore page is regional trends—local vibes rule your feed.
- Personalized hashtags boost reach by 25%—custom tags are the new hack.
Reels Takeover
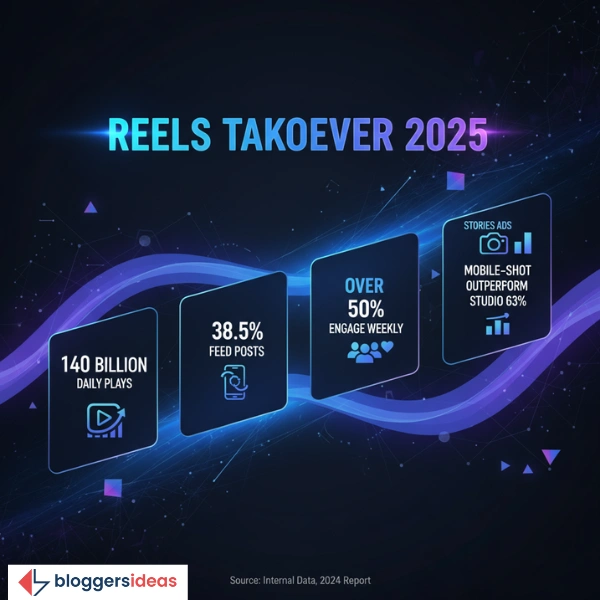
- Reels play 140 billion times daily across Instagram and Facebook—mind-blowing!
- 38.5% of feed posts are Reels—they’re everywhere you look.
- Over 50% engage with a Reel weekly—half of us can’t resist.
- Mobile-shot Stories ads beat studio ones 63% of the time—raw wins over polished.
New Surprises for 2026
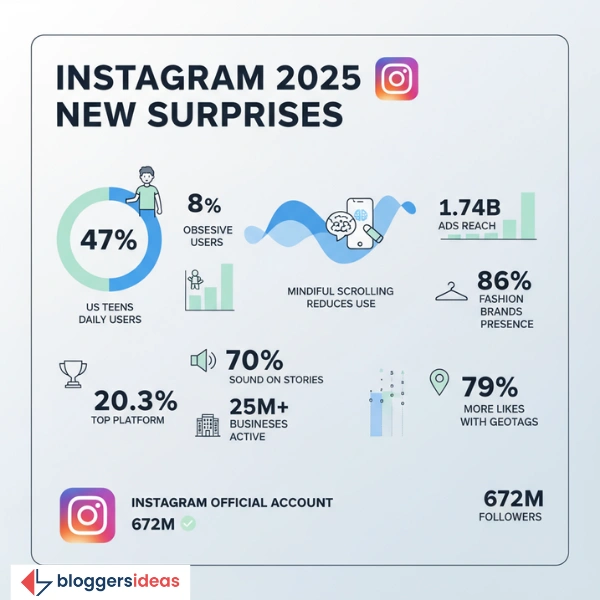
- 47% of US teens use Instagram daily, 8% obsessively—it’s their lifeblood (Statista, 2025).
- 20.3% of internet users pick Instagram as their top platform—beating Twitter (Kepios, 2025).
- Mindful scrolling reminders cut daily use by 10 minutes—Instagram’s nudging us to chill.
- 70% watch Stories with sound on—audio’s key now (Hootsuite, 2025).
- Over 25 million businesses are active—up from 2024 (Instagram Business Report, 2025).
- Ads reach 1.74 billion monthly—31% of all internet users (Datareportal, 2025).
- 86% of fashion brands are on Instagram—style central (SocialPilot, 2025).
- Posts with geotags get 79% more love—location’s a big deal still.
- Instagram’s own account? 672 million followers—crowning itself king!
A Fresh Twist: Instagram’s Rewiring Our World
Here’s the new angle: Instagram’s not just an app—it’s a lifestyle architect. In 2025, it’s shaping how we shop (hello, AR try-ons!), how we bond (Reels are our new campfire stories), and even how we dream (NFTs as digital trophies?).
It’s less about likes now and more about living—connecting us to trends, creators, and stuff we didn’t know we needed.
Take Reels: they’re not just fun—they’re mini-movies selling us ideas, products, and vibes in 15 seconds flat. Or Stories: they’re quick peeks into lives and brands, making us feel like insiders.
And with AI tweaking our feeds, it’s like Instagram knows us better than we know ourselves. It’s wild to think a scroll could influence our next outfit, trip, or even career move!
How to Ride the Instagram Wave
Want in on this? Tools like Measure Studio (shoutout to them!) can help. They track your Instagram game—ads, posts, Reels, you name it. I’ve used it to see what flops and what flies.
It shows real-time stats like reach, likes, and sales, so you’re not guessing. You can spot which Reel got the most shares or if your Story ad’s a dud. It’s like having a coach whispering, “Hey, try this next!”
For regular folks or small brands, it’s a way to level up—know your audience, tweak your posts, and watch engagement climb. Custom metrics let you zoom in on what matters—maybe it’s comments from your city or clicks to your shop.
FAQs About Instagram Statistics
1. Is Instagram still popular in 2025?
Yes, Instagram remains one of the most popular platforms in 2025 with 2.42 billion monthly active users and over 500 million daily users. It continues to grow, especially among Gen Z and Millennials.
2. What is the average engagement rate on Instagram in 2025?
The average engagement rate is 1.44%, though this is down 28% from last year. Reels and video content now generate 49% more engagement than static posts.
3. How is Instagram used for shopping in 2025?
Instagram has become a top e-commerce platform in 2025, generating $40 billion in global sales. 70% of users use the app to discover new products, and 130 million click on shopping posts monthly.
4. Why are Reels so important on Instagram now?
Reels dominate in 2025, making up 38.5% of feed posts and grabbing 45% of total engagement time. They play over 140 billion times daily across Instagram and Facebook combined.
5. How are AI and AR changing Instagram in 2025?
Over 60% of creators use AI tools for editing, and 75% of shoppers engage with AR features like virtual try-ons. AI also personalizes feeds and boosts discoverability through tailored hashtags.
Also Read:
Wrapping It Up
Instagram’s not slowing down in 2025—it’s speeding up, reshaping how we live, laugh, and shop. These 47 stats? They’re your cheat sheet to understanding its magic.
Whether you’re a scroller, a creator, or a brand, there’s something here for you. With Reels ruling, Stories sticking, and AI sneaking in, Instagram’s more than an app—it’s our digital pulse.
So, next time you’re scrolling, think: this isn’t just fun—it’s the future. Got a fave stat? Drop it below—I’m all ears!
Source: Statista, Forbes