Uber remains a global leader in ride-hailing and delivery, holding over 76% of the global ride-hailing market. As of 2025, the platform continues to expand, offering significant opportunities for millions of drivers worldwide.
This overview highlights the most recent Uber Statistics for 2025, focusing on users, earnings, revenue, and innovations shaping the gig economy.
Uber’s Global Reach and Growth
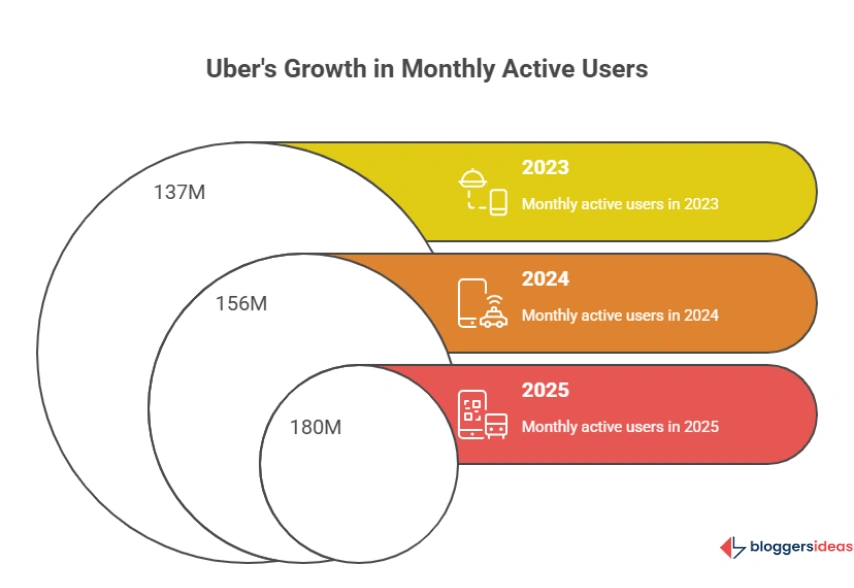
Uber dominates the transportation industry with 180 million monthly active users and 8.8 million drivers worldwide.
In Q2 2025, drivers completed 3.26 billion trips, contributing to $24.18 billion in total revenue and $46.7 billion in gross bookings for that quarter alone.
| Metric | 2025 (Q1+Q2) | 2024 | 2023 |
|---|---|---|---|
| Monthly Active Users | 180M | 156M | 137M |
| Drivers | 8.8M | 7.8M | 6M |
| Trips | 6.29B | 11.27B | 9.44B |
| Gross Bookings | $89.5B | $162.7B | $137.8B |
| Revenue | $24.18B | $43.97B | $37.28B |
Source: Business of Apps
Uber Drivers: The Core Workforce
In Q2 2025, Uber had 8.8 million active drivers, up 12.05% year-over-year. Among them, about 230,000 drive Zero Emission Vehicles (ZEVs), completing 105.5 million trips in Q1 2025.
| Quarter | Drivers (in millions) |
|---|---|
| Q2 2025 | 8.8 |
| Q2 2024 | 7.8 |
| Q2 2023 | 6 |
Uber Driver Earnings in 2026
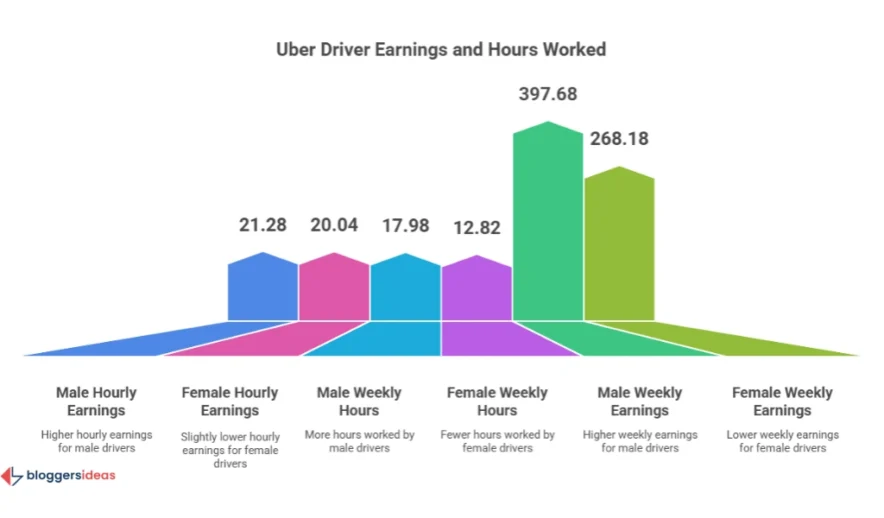
Male drivers earn $21.28/hour and $397.68/week, while female drivers earn $20.04/hour and $268.18/week, with men averaging more hours.
| Monthly Earnings | % of Drivers |
|---|---|
| $0–$99 | 45% |
| $100–$499 | 39% |
| $500–$999 | 11% |
| $1,000–$1,499 | 4% |
| $1,500–$1,999 | 2% |
Uber’s Financial Highlights
Uber recorded $43.97 billion in total revenue in 2024 and $24.18 billion in the first half of 2025. The Mobility segment remains the primary source of income, generating $13.78 billion in H1 2025.
| Year | Mobility | Delivery | Freight |
|---|---|---|---|
| 2025 (H1) | $13.78B | $7.87B | $2.52B |
| 2024 | $25.08B | $13.75B | $5.14B |
Uber also made a net profit of $9.8 billion in 2024, up from $1.8 billion in 2023, marking a strong financial rebound.
Uber Users: Demographics & Behavior
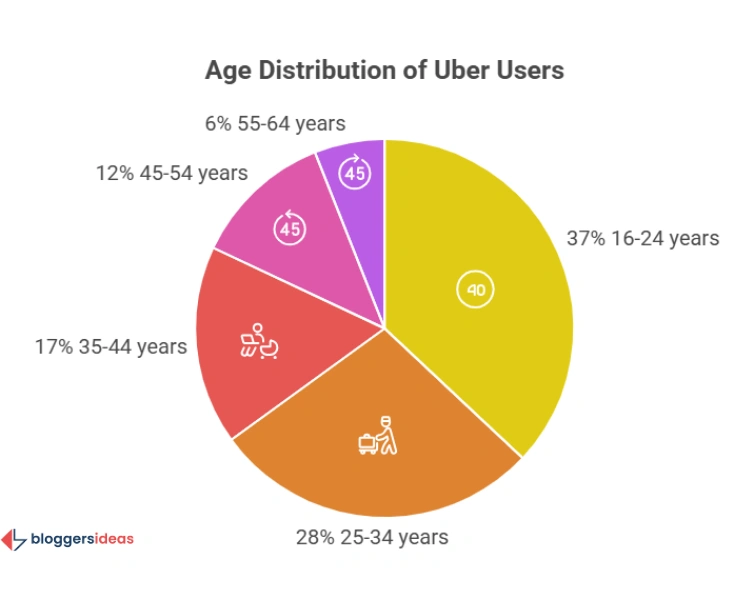
Uber users are nearly evenly split by gender — 52% men and 48% women. Younger users dominate, with 37% aged 16–24 and 28% aged 25–34.
| Age Group | % of Users |
|---|---|
| 16–24 | 37% |
| 25–34 | 28% |
| 35–44 | 17% |
| 45–54 | 12% |
| 55–64 | 6% |
Geographically, 48% of U.S. users live in suburban areas, 46% in cities, and 6% in rural regions.
Uber Market Share and Competitors
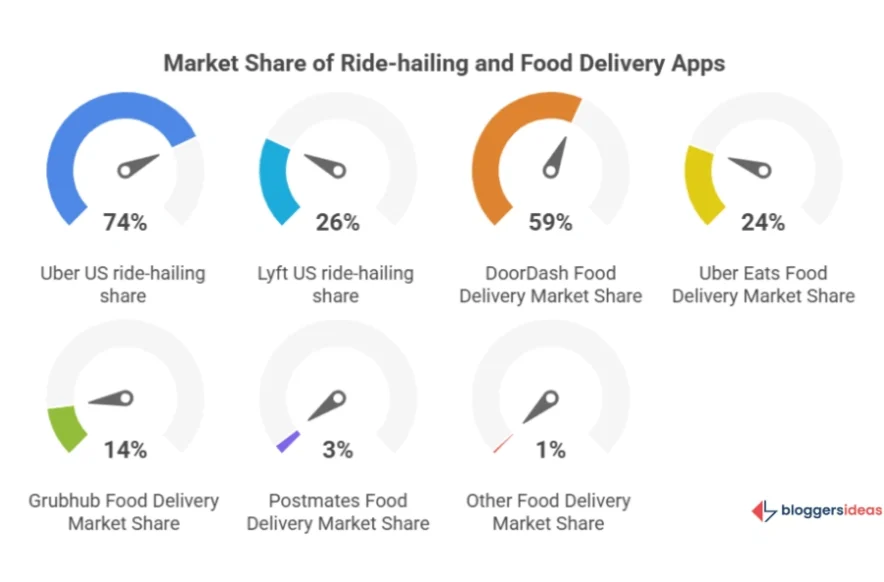
Uber commands 74% of the U.S. ride-hailing market, far ahead of Lyft (26%). In food delivery, Uber Eats holds 24%, second only to DoorDash (59%).
| Platform | Market Share |
|---|---|
| DoorDash | 59% |
| Uber Eats | 24% |
| Grubhub | 14% |
| Postmates | 3% |
Uber operates in 72 countries and 10,000+ cities, with India hosting over 1.5 million drivers.
Brand Recognition & Membership
Uber enjoys 90% brand awareness, 61% popularity, and 62% usage. Its Uber One membership now exceeds 5 million members across 16 countries, priced at $9.99/month or $96/year, offering discounts and free deliveries.
Uber Eats: Expanding Food Delivery
Uber Eats operates in 10,500 cities across 70 countries with 825,000 restaurant partners as of 2022.
| Year | Cities | Restaurant Partners |
|---|---|---|
| 2023 | 10,500 | – |
| 2022 | 10,000 | 825,000 |
| 2021 | 6,000 | 900,000 |
Innovation and Future Outlook
Uber invests heavily in autonomous vehicles, partnering with Cruise, Waymo, and Avride. These partnerships will bring self-driving deliveries and rides to cities like Austin and Atlanta.
Uber is also advancing sustainability goals:
- 80% of Uber Eats orders in recyclable packaging by 2025.
- 100% of rides in zero-emission vehicles by 2040.
FAQs About Uber Statistics
1. How many Uber drivers are currently active globally in 2025?
As of Q2 2025, over 8.8 million drivers are actively working on the Uber platform across the globe, representing a significant 12.05% year-over-year increase from 2024.
2. What are the average hourly and weekly earnings for Uber drivers in 2025?
Male Uber drivers, on average, earn $21.28 per hour and approximately $397.68 weekly, while female Uber drivers average $20.04 per hour and $268.18 weekly, reflecting differences primarily in the hours they choose to work.
3. What percentage of Uber’s market share does it hold in ride-hailing and food delivery in 2025?
Uber commands a dominant 74% of the ride-hailing market share in the United States, and its Uber Eats service holds 24% of the food delivery market share in 2025.
4. Is Uber investing in autonomous vehicles, and how will this affect drivers in the future?
Yes, Uber is heavily investing in autonomous vehicle technology through partnerships with companies like Cruise, Waymo, and Avride, planning to deploy self-driving fleets in cities like Austin and Atlanta by 2025, which will gradually introduce new operational dynamics and potential shifts for human drivers as the technology matures.
5. What are Uber’s sustainability goals for its fleet and operations?
Uber aims to become a zero-emissions mobility platform, with a goal to have 80% of Uber Eats orders packaged in recyclable materials by 2025 and to achieve 100% of its rides in zero-emission vehicles by 2040.
Also Read:
- Facebook Users Statistics
- Marketing Automation Statistics
- YouTube Statistics
- Netflix Subscriber Statistics
- Affiliate Marketing Statistics
Conclusion:
Uber continues to dominate global mobility with 180 million users, 8.8 million drivers, and a rapidly growing focus on sustainability and technology.
With innovations like autonomous delivery, strong profitability, and expanding driver opportunities, Uber remains at the forefront of the modern gig economy.
Source: Uber.