The United States stands at a pivotal moment in its immigration history.
As we move through 2026, the country continues to be the world’s premier destination for immigrants, hosting more foreign-born residents than any other nation.
Yet beneath the surface of these impressive numbers lies a more complex story—one of tightening enforcement, shifting demographics, and evolving economic impacts that will reshape America’s future for decades to come.
Immigration has always been central to the American experience, but the scale and significance of migration flows in 2026 are unprecedented.
With over 51 million foreign-born residents, immigrants now represent a larger share of the population than at any point since the early 20th century.
At the same time, policy shifts have created the first sustained decline in immigrant population growth in more than half a century, marking a potential turning point in American demographic history.
This comprehensive analysis explores the current state of US immigration through detailed statistics, emerging trends, and exclusive insights into what these changes mean for America’s economic and social future.
Current Immigration Landscape: The Numbers That Matter
Overall Foreign-Born Population
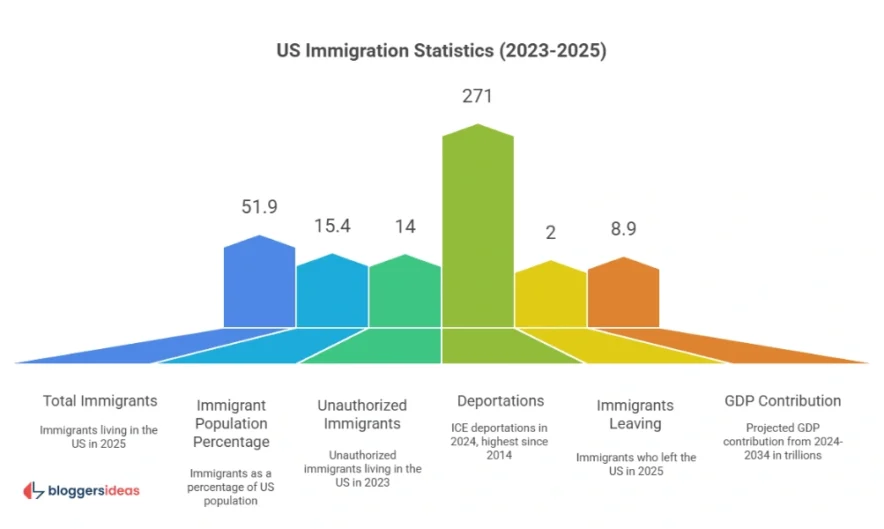
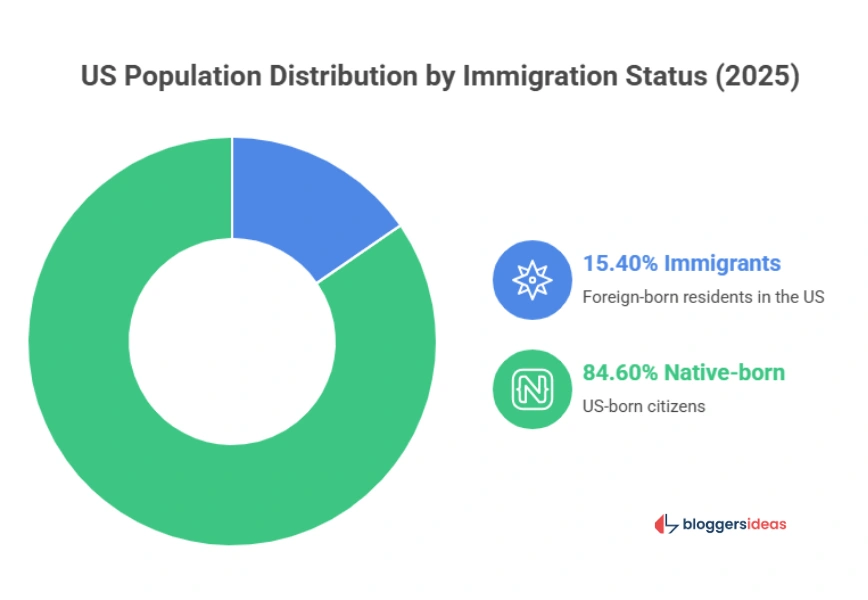
As of mid-2025, the United States was home to 51.9 million immigrants, representing approximately 15.4% of the total population.
This figure reflects a slight but significant decline from earlier in the year, when the foreign-born population peaked at 53.3 million, or 15.8% of all US residents—the highest percentage ever recorded.
| Time Period | Foreign-Born Population | Share of Total Population |
| Mid-2025 | 51.9 million | 15.4% |
| Early 2025 | 53.3 million | 15.8% |
| 2023 | 47.8 million | 14.1% |
| 2020 | 45.0 million | 13.7% |
This recent decline marks the first notable drop in immigrant population in over 50 years, driven by multiple converging factors including increased deportations, higher voluntary departures, and stricter border enforcement policies that have slowed new arrivals.
Also read about: Average US Salary by State in 2026
Historical Context: Two Centuries of Growth
To understand the significance of current immigration levels, we must look at the long arc of American immigration history.
Since 1850, when the United States had just 2.2 million foreign-born residents, the immigrant population has grown by more than 2,000%.
This remarkable expansion reflects America’s enduring appeal as a destination for people seeking economic opportunity, political freedom, and family reunification.
US Immigrant Population Growth (1850-2025)
| Year | Immigrant Population | % of Total Population |
| 1850 | 2.2 million | 9.7% |
| 1900 | 10.3 million | 13.6% |
| 1950 | 10.3 million | 6.9% |
| 1980 | 14.1 million | 6.2% |
| 2000 | 31.1 million | 11.1% |
| 2010 | 39.9 million | 12.9% |
| 2020 | 45.0 million | 13.7% |
| 2023 | 47.8 million | 14.1% |
| 2025 | 51.9 million | 15.4% |
The data reveals several important patterns. Immigration reached historic highs in the early 1900s before declining dramatically through the mid-20th century due to restrictive legislation and global conflicts.
The modern immigration era, beginning in the 1970s after the Immigration and Nationality Act of 1965, has seen sustained growth that has fundamentally transformed American demographics.
Also read about: 8 Best USA Proxies Providers
Global Comparison: Where America Stands
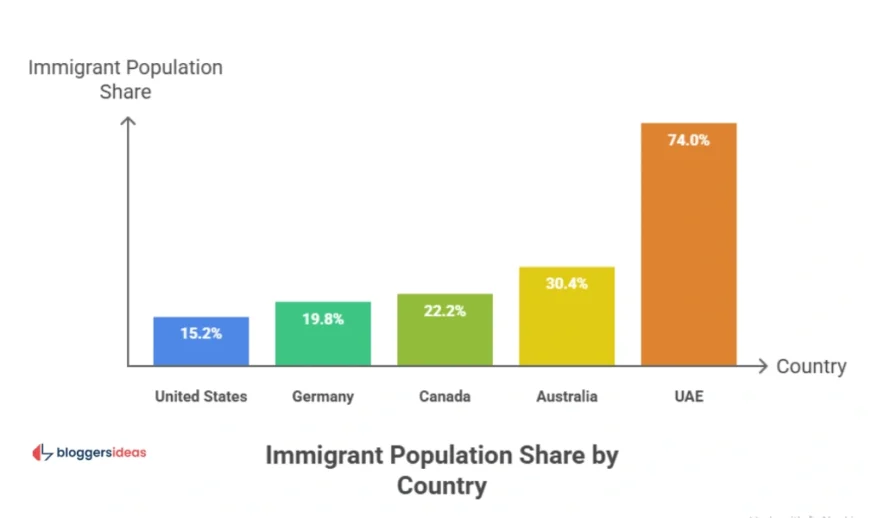
While the United States hosts the largest absolute number of immigrants in the world, its immigrant share of population is actually moderate compared to other developed nations and immigrant-destination countries.
International Comparison of Immigrant Populations (2025)
| Country | Immigrant Share of Population |
| United Arab Emirates | 74.0% |
| Australia | 30.4% |
| Canada | 22.2% |
| Germany | 19.8% |
| United States | 15.2% |
| United Kingdom | 14.3% |
| France | 13.2% |
Countries like Australia, Canada, and the UAE have much higher percentages of foreign-born residents, often by design through immigration policies that explicitly aim to attract skilled workers and address demographic challenges.
The US percentage, while historically high for America, remains below those of these peer nations, suggesting potential room for growth if policy directions shift.
Immigration Status Breakdown
The foreign-born population in the United States comprises individuals with vastly different legal statuses, rights, and pathways to permanent residence.
Understanding this breakdown is essential to grasping the full complexity of American immigration.
Legal Status Distribution (2023)
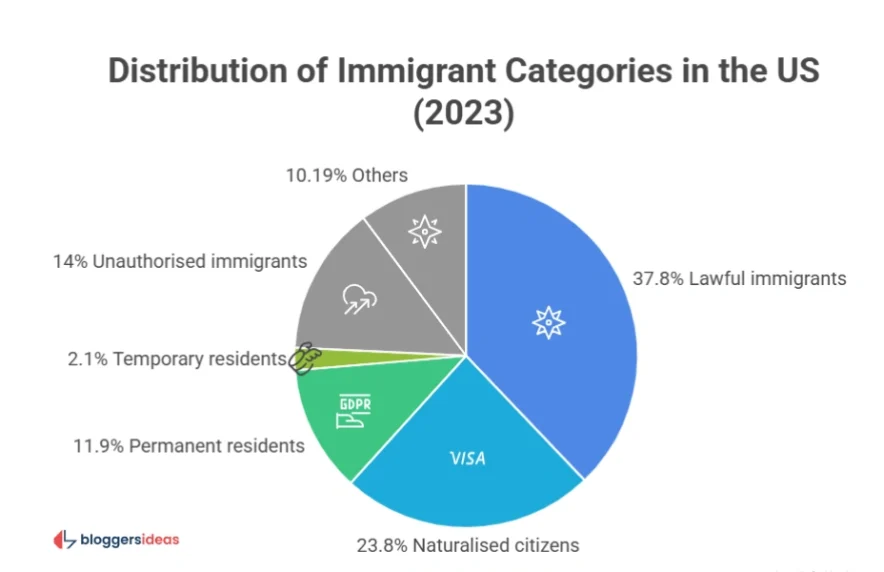
| Category | Population | Share of Total | Share of Foreign-Born |
| Naturalized Citizens | 23.8 million | 7.0% of US population | 46% of immigrants |
| Lawful Permanent Residents | 11.9 million | 3.5% of US population | 23% of immigrants |
| Temporary Legal Residents | 2.1 million | 0.6% of US population | 4% of immigrants |
| Unauthorized Immigrants | 14.0 million | 4.1% of US population | 27% of immigrants |
| Total Lawful Immigrants | 37.8 million | 11.1% of US population | 73% of immigrants |
Nearly half of all foreign-born residents have become naturalized US citizens, demonstrating deep integration and long-term commitment to the United States.
This high naturalization rate signals that immigration is not merely temporary labor migration but represents permanent demographic change.
The Unauthorized Population: Record Highs and Policy Challenges
In 2023, the United States had an estimated 14 million unauthorized immigrants, the highest number ever recorded.
This population has grown significantly over the past two decades despite increased enforcement efforts, reflecting the complex push-and-pull factors that drive migration flows.
Unauthorized immigrants come from diverse backgrounds, though certain countries dominate.
Mexico has historically been the largest source, though the Mexican unauthorized population has declined in recent years while populations from Central America, Asia, and other regions have grown.
Many unauthorized immigrants have lived in the United States for decades, have US-citizen children, and are deeply embedded in communities and workforces across the country.
The policy challenge is stark: how to address a population of 14 million people who lack legal status while maintaining rule of law, border security, and economic stability.
Various proposals have been debated, from pathways to citizenship to enhanced enforcement to guest worker programs, but comprehensive immigration reform has remained politically elusive for years.
Enforcement and Deportation: The New Reality
Immigration enforcement has intensified dramatically in recent years, reaching levels not seen in over a decade.
This enforcement surge has significant implications for immigrant communities, labor markets, and America’s international reputation.
Record Deportation Numbers
In fiscal year 2024, US Immigration and Customs Enforcement (ICE) deported 271,484 individuals, the highest annual total since 2014.
This represents a substantial increase from previous years and signals a major policy shift toward enforcement-heavy approaches.
Beyond formal deportations, over 2 million immigrants left the United States in 2025, with many departing voluntarily rather than facing removal proceedings.
This voluntary departure phenomenon reflects increased enforcement pressure, changing economic conditions, and shifting perceptions of opportunity and welcome in the United States.
ICE Detention Statistics (2025)
- 46,015 individuals in ICE detention facilities at any given time
- Peak detention levels reached 66,000 individuals during high-enforcement periods
- Over 8,800 immigration-related flights operated in 2025 for deportations and transfers
These numbers indicate a shift toward faster processing and removal rather than extended detention, though civil liberties advocates have raised concerns about due process and conditions in detention facilities.
Historical Deportation Context
Comparing deportation numbers across different administrations reveals important patterns, though historical comparisons are complicated by changing definitions and reporting methods.
Immigration Enforcement Actions by Presidential Administration
| Administration | Total Enforcement Actions | Notes |
| Clinton (1993-2001) | 12.2 million | Includes voluntary returns |
| Bush (2001-2009) | 10.3 million | Includes voluntary returns |
| Obama (2009-2017) | 5.3 million | Primarily formal removals |
| Trump (2017-2020) | 1.5 million total | 267,000 in 2019 peak year |
| Biden (2021-2025) | Data still being compiled | 271,484 in 2024 alone |
Earlier administrations’ numbers included both formal removals and voluntary returns at the border, inflating total figures. More recent data focuses on formal deportations, making direct comparisons difficult.
However, the 2024 figure of 271,484 formal deportations represents the highest level of enforcement-focused removals in modern history.
Demographic Profile: Who Are America’s Immigrants?
Understanding who immigrants are—their ages, origins, skills, and characteristics—is essential to grasping their economic and social impact.
Age Distribution: A Working-Age Population
One of the most striking features of the immigrant population is its concentration in working-age cohorts, which has profound implications for labor markets and economic growth.
Age Distribution: Foreign-Born vs. US-Born Population
| Age Group | Foreign-Born | US-Born |
| 0-15 years (children) | 4.9% | 21.4% |
| 16-64 years (working age) | 77.1% | 60.9% |
| 65+ years (seniors) | 18.0% | 17.7% |
More than three-quarters of immigrants are of working age, compared to just 61% of the native-born population.
This demographic advantage means immigrants disproportionately contribute to the workforce, tax base, and economic productivity while making fewer demands on education systems.
However, the aging of the immigrant population—with 18% now over 65—means growing demands on healthcare and social services in coming decades.
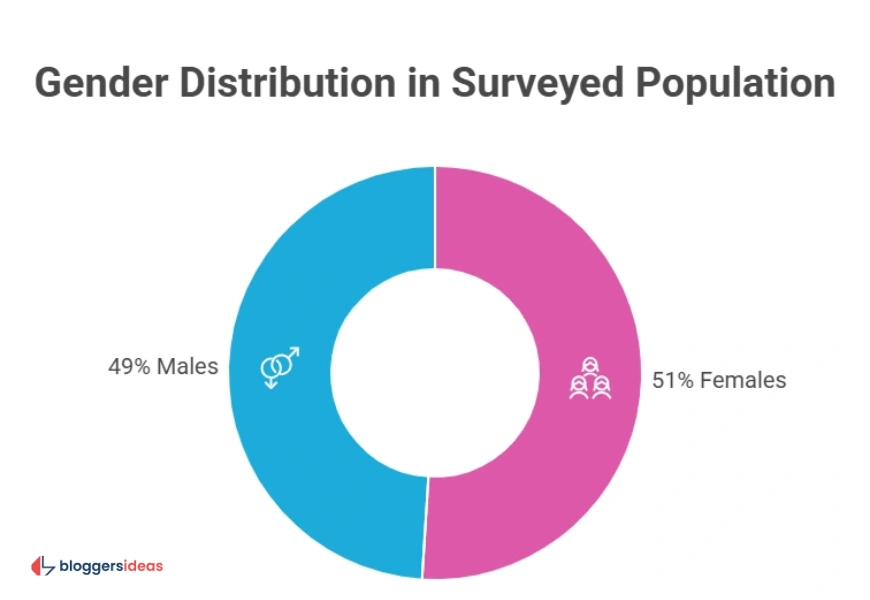
Gender Composition
The US immigrant population is nearly evenly split between men and women, with 51% female and 49% male.
This relative balance differs from some other immigrant-destination countries where male labor migration predominates, and reflects the importance of family-based immigration in US policy.
Countries of Origin: Shifting Patterns
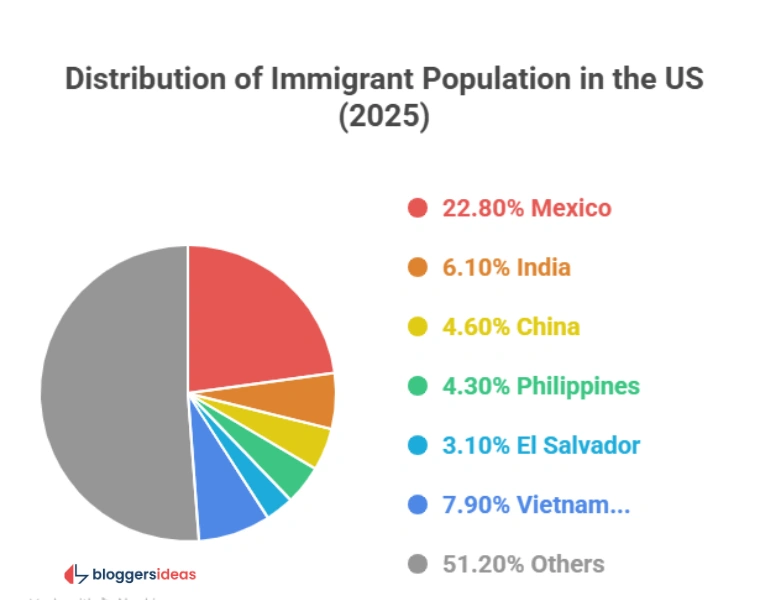
Where immigrants come from has changed dramatically over recent decades, with profound implications for American culture, politics, and international relationships.
Top Source Countries for US Immigrants (2025)
| Country | Share of Total Immigrant Population | Approximate Number |
| Mexico | 22.8% | 11.8 million |
| India | 6.1% | 3.2 million |
| China | 4.6% | 2.4 million |
| Philippines | 4.3% | 2.2 million |
| El Salvador | 3.1% | 1.6 million |
| Vietnam | 2.8% | 1.5 million |
| Cuba | 2.7% | 1.4 million |
| Dominican Republic | 2.4% | 1.2 million |
| Guatemala | 2.2% | 1.1 million |
| All Other Countries | 59.1% | 30.7 million |
Mexico remains by far the largest source country, though its share has declined from over 30% in the early 2000s.
India has emerged as the fastest-growing source, particularly for skilled immigration in technology, healthcare, finance, and academia.
The diversification of source countries—with nearly 60% coming from countries outside the top nine—reflects America’s truly global immigrant population.
Emerging Trend: The Rise of Indian Immigration
India deserves special attention as it has become the primary driver of new skilled immigration to the United States.
Indian immigrants now dominate several high-growth sectors including technology, where they hold significant percentages of engineering and management roles at major companies, healthcare, where Indian-trained physicians make up a substantial portion of the medical workforce, and higher education, where Indian students and faculty are increasingly prominent.
This shift from predominantly Latin American to increasingly Asian immigration has important implications for debates about immigration policy, as skilled Asian immigrants generally face different policy frameworks and public perceptions than lower-skilled Latin American migrants, though both groups contribute significantly to American prosperity.
Economic Impact: Immigration as Growth Engine
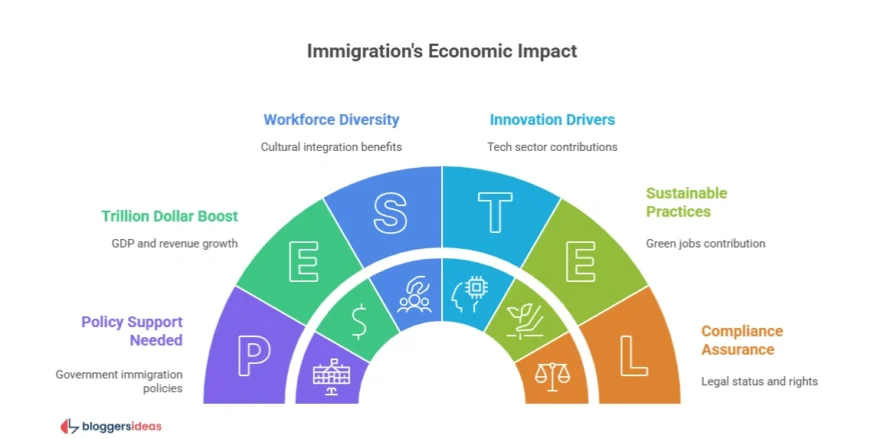
Immigration’s economic impact extends far beyond individual immigrants to shape America’s overall economic trajectory, competitiveness, and fiscal health.
Massive GDP Contribution
According to recent economic projections, immigration is expected to add $8.9 trillion to US GDP from 2024 to 2034, underscoring immigrants’ central role in American economic growth.
This economic boost comes through multiple channels including expanding the labor force, increasing consumer demand, driving entrepreneurship and innovation, paying taxes that support public services, and filling critical labor shortages in key sectors.
Projected Fiscal Impact (2024-2034)
| Economic Measure | Projected Impact |
| Total GDP Contribution | $8.9 trillion |
| Added Federal Revenue | $1.2 trillion |
| Annual GDP Boost by 2034 | $167 billion per year |
| Net Fiscal Contribution | Positive across all models |
These projections assume continued immigration flows at levels similar to recent years.
If restrictive policies significantly reduce immigration, these economic benefits would be substantially diminished, with serious consequences for growth, innovation, and fiscal sustainability.
Sector-Specific Contributions
Immigrants play outsized roles in specific sectors critical to the American economy.
In healthcare, immigrants represent over 18% of healthcare workers despite being 15% of the population, including disproportionate shares of physicians, nurses, and home health aides.
In technology, immigrants account for over one-quarter of all technology workers and over half of workers with advanced STEM degrees in some fields.
In construction, immigrants account for nearly 25% of the workforce and dominate certain skilled trades. In agriculture, immigrants perform the majority of farm labor, with some estimates suggesting over 70% of agricultural workers are foreign-born.
Finally, in the gig economy, immigrants are heavily represented in ride-sharing, delivery, and other platform-based work.
The concentration of immigrants in these sectors means that enforcement actions or reduced immigration can create immediate labor shortages that cascade into broader economic effects.
The Remote Work Revolution and Immigration
An emerging and underappreciated trend is the intersection of remote work and immigration.
With 27.5% of Americans working remotely in 2025—a level that has stabilized after the pandemic-era peak—immigrants now have unprecedented ability to access opportunities beyond traditional immigrant gateway cities.
Benefits of Remote Work for Immigration
- Skilled immigrants can work for major employers while living in lower-cost areas
- Rural areas and smaller cities can attract immigrant talent previously concentrated in coastal metros
- Startups and small companies can access national and international talent pools
- Immigrants can maintain closer connections to countries of origin while building US careers
- Geographic dispersion reduces some political tensions around immigration in gateway cities
This remote work effect may accelerate immigrant integration while also dispersing economic benefits more broadly across the country, though it also raises questions about community formation and immigrant support networks.
Policy Risks and Economic Consequences
While the economic case for immigration is strong, restrictive policy directions carry substantial risks that policymakers often underestimate.
Workforce Reduction Scenarios
Economic modeling suggests that severely restrictive immigration policies could lead to catastrophic labor shortages.
Under high-restriction scenarios, the United States could face a workforce reduction of 6.8 million workers by 2028 and a staggering loss of 15.7 million workers by 2035.
These reductions would come at exactly the wrong time demographically, as the baby boom generation fully exits the workforce and birth rates remain below replacement level.
Without immigration, the US workforce would begin shrinking, creating a demographic crisis similar to those facing Japan and parts of Europe.
Projected Economic Impacts of Severe Restrictions
| Time Horizon | Workforce Impact | GDP Impact | Key Consequences |
| By 2028 | -6.8 million workers | -$1.8 trillion cumulative | Acute labor shortages |
| By 2035 | -15.7 million workers | -$12.1 trillion cumulative | Structural economic damage |
The projected GDP reduction of $12.1 trillion by 2035 under severe restriction scenarios would represent one of the largest self-inflicted economic wounds in American history, with consequences including accelerated inflation due to labor scarcity, reduced tax revenues worsening federal debt, diminished innovation and entrepreneurship, loss of global competitiveness in key industries, and potential social service crises in sectors like healthcare and elder care.
The Dependency Ratio Challenge
America faces a looming demographic challenge as the population ages. The dependency ratio—the number of non-working-age individuals relative to working-age individuals—is projected to deteriorate significantly over coming decades without immigration.
Immigrants, with their concentration in working-age cohorts, are essential to maintaining a sustainable dependency ratio and funding social programs like Social Security and Medicare.
Without sustained immigration, the United States would face impossible choices between cutting benefits for retirees, dramatically raising taxes on a shrinking workforce, or accumulating unsustainable debt.
Immigration provides a path to avoid this demographic trap, but only if policies allow sufficient flows to offset aging and low birth rates.
Future Trends and Projections
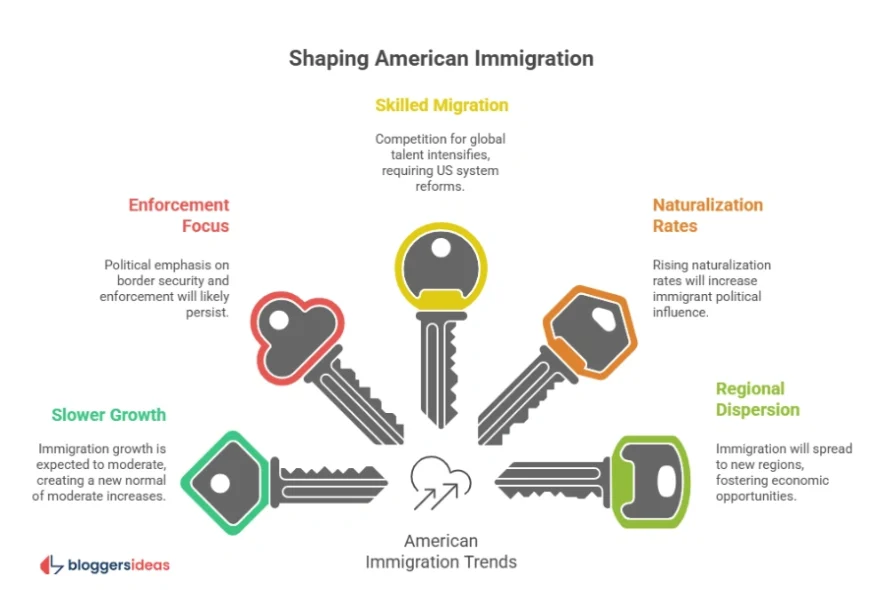
Looking ahead, several key trends will shape American immigration through 2030 and beyond.
Slower Growth, Not Reversal
Despite recent declines, immigration is unlikely to reverse entirely. Economic incentives, family ties, global instability, and America’s enduring appeal ensure continued flows.
However, growth will likely be slower than the rapid expansion of the 2010s and early 2020s, creating a new normal of moderate increases rather than dramatic surges.
Enforcement-Focused Policy Environment
The political environment has shifted decisively toward enforcement-heavy approaches, with both major parties competing to demonstrate border security credentials.
This emphasis on enforcement will likely persist regardless of electoral outcomes, meaning higher deportation numbers, more aggressive interior enforcement, and stricter screening of legal immigration applications will continue to characterize the system.
Rising Skilled Migration and Competition
As global competition for talent intensifies, the United States faces growing challenges in attracting and retaining skilled immigrants.
Countries like Canada, Australia, and many European nations have implemented more streamlined, merit-based systems that can process skilled immigrants faster than the US system.
If America cannot reform its skilled immigration pathways, it risks losing competitive advantage in the global talent competition, particularly in technology, research, and healthcare.
Higher Naturalization Rates
The trend toward higher naturalization rates will likely continue, driven by immigrants’ desire for security and full political participation, concerns about enforcement and potential policy changes, and the growing number of immigrants who have been in the US long enough to qualify.
As naturalization rates rise, the political influence of immigrant communities will grow, potentially creating constituencies for more immigrant-friendly policies in the future.
Regional Dispersion Patterns
Immigration will likely become less concentrated in traditional gateway cities and states as remote work, lower costs of living, and immigrant network effects drive geographic dispersion.
States in the South, Mountain West, and Midwest that have historically had small immigrant populations may see faster growth, bringing both economic opportunities and social adjustments.
State and Regional Variations
Immigration’s impact varies dramatically across states and regions, creating very different local experiences and policy debates.
Top Immigrant-Destination States
| State | Foreign-Born Population | % of State Population |
| California | ~10.5 million | 27% |
| Texas | ~5.2 million | 18% |
| Florida | ~4.6 million | 21% |
| New York | ~4.5 million | 23% |
| New Jersey | ~2.1 million | 23% |
| Illinois | ~1.8 million | 14% |
California, Texas, Florida, and New York together host over half of all US immigrants, creating both opportunities and challenges for these states.
California and New York have long been immigrant destinations with established infrastructure and services, while Texas and Florida have seen more recent rapid growth that has strained systems and sparked political debate.
Emerging Destinations
Beyond traditional gateways, immigration is growing rapidly in states like Georgia, North Carolina, Nevada, Arizona, and Washington, where immigrant populations have doubled or tripled since 2000.
These emerging destinations often lack the established immigrant support infrastructure of traditional gateways, creating both integration challenges and opportunities for innovative approaches.
Integration and Social Outcomes
Immigration’s success depends not just on numbers but on how well immigrants integrate economically and socially.
Economic Mobility
Research consistently shows that immigrants demonstrate strong upward economic mobility, though patterns vary by country of origin, legal status, and generation.
First-generation immigrants often start in lower-wage jobs but experience significant income growth over time as they acquire English proficiency, credentials, and experience.
Second-generation immigrants (US-born children of immigrants) typically match or exceed native-born Americans in educational attainment and income.
Language Acquisition
English proficiency among immigrants has improved significantly over recent decades.
While first-generation immigrants often struggle with English, their children almost universally become fluent, and third-generation immigrants typically speak only English.
This pattern of rapid linguistic assimilation mirrors historical immigrant groups and suggests successful integration despite concerns about bilingualism.
Civic Participation
As naturalization rates rise, immigrant civic participation is increasing.
Voter registration and turnout among naturalized citizens has grown substantially, and immigrants are increasingly involved in local governance, community organizations, and civic institutions.
This political integration represents successful incorporation into American democracy, though it also raises stakes in immigration policy debates as immigrant communities gain political voice.
Challenges and Controversies
Immigration remains deeply controversial, with legitimate concerns and challenges that must be acknowledged.
Labor Market Effects
While immigration broadly benefits the economy, research suggests modest negative effects on wages for some native-born workers without high school degrees who compete directly with immigrant labor.
These effects are generally small—most estimates suggest wage reductions of 1-3% for affected groups—but they are concentrated among already vulnerable workers, raising equity concerns.
Fiscal Impacts at Different Government Levels
Immigration’s fiscal impact varies by government level.
At the federal level, immigrants are generally net fiscal contributors, paying more in taxes than they receive in benefits, particularly Social Security and Medicare taxes paid by unauthorized workers who will never claim benefits.
At state and local levels, the picture is more mixed, as these governments bear education and emergency healthcare costs while receiving less tax revenue. This mismatch creates political tensions, particularly in high-immigration states.
Integration Challenges
Successful integration requires substantial investment in English classes, job training, credential recognition, and social services.
Many communities lack adequate resources for these integration supports, leaving immigrants struggling to access opportunities and creating social friction.
Investing in integration infrastructure could significantly improve outcomes but requires political will and funding.
Security and Public Safety
Concerns about immigration and public safety persist, though research generally finds that immigrants commit crimes at lower rates than native-born Americans.
However, the presence of any criminal activity by unauthorized immigrants generates political controversy, and high-profile cases can shape public opinion regardless of overall statistical patterns.
Balancing security concerns with immigrant rights remains an ongoing challenge.
FAQs About US Immigration Statistics
1. How many immigrants live in the United States in 2026?
About 51.9 million immigrants live in the United States as of mid-2025. They make up roughly 15.4% of the total population, the highest share in modern US history.
2. Why did the immigrant population start to decline recently?
The decline happened because of more deportations, more people leaving voluntarily, and stricter border rules that reduced new arrivals. This is the first drop in over 50 years.
3. How many undocumented immigrants are in the US?
There were about 14 million undocumented immigrants in 2023, which is the highest number ever recorded. Many have lived in the US for years and have strong family and work ties.
4. How does immigration help the US economy?
Immigrants help grow the economy by working, paying taxes, starting businesses, and filling job shortages. Immigration is expected to add $8.9 trillion to the US economy by 2034.
5. What jobs do immigrants mostly work in?
Immigrants play a big role in healthcare, technology, construction, agriculture, and the gig economy. Many of these industries would face serious worker shortages without them.
Also Read:
- Infographics Statistics
- Marketing Automation Statistics
- Personalization Statistics
- Affiliate Marketing Statistics
- Voice Search Statistics
Conclusion: Immigration at a Crossroads
In 2026, US immigration stands at a turning point.
Immigrants continue to power economic growth, innovation, and workforce stability, even as enforcement tightens and departures rise.
The economic benefits are clear, but policy choices now carry serious long-term consequences.
Whether the United States chooses restriction or balance will shape its economy, workforce, and national identity for decades to come.
Source: Wikipedia, American Immigration Council