The mobile device has become central to modern life, influencing how we connect, work, and find entertainment. From morning alarms to late-night playlists, it shapes nearly every moment of the day.
With more than 90% of the global population owning a mobile device, this technology has redefined communication, commerce, and digital marketing.
This article explores Mobile Internet Traffic Statistics 2025, offering a data-driven look at how mobile devices dominate internet usage worldwide.
It breaks down where mobile traffic comes from, how people use their phones, and what trends are shaping the next wave of mobile growth.
The Ascendance of Mobile Internet Traffic: A Global Perspective
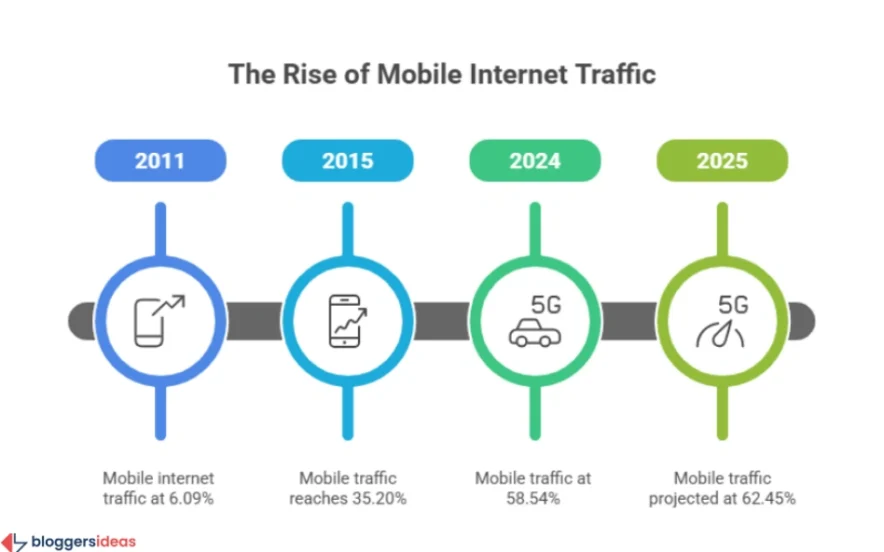
Mobile devices now drive most of the world’s online activity, with 62.45% of total internet traffic coming from mobile in 2025—a 75% increase since 2015.
| Year | Global Mobile Traffic Share |
|---|---|
| 2015 | 35.20% |
| 2020 | 51.61% |
| 2024 | 58.54% |
| 2025 | 62.45% |
In the United States, mobile accounts for 47.79% of internet traffic, reflecting a strong but balanced mix of desktop and mobile usage.
| Year | U.S. Mobile Traffic Share |
|---|---|
| 2015 | 29.02% |
| 2020 | 49.99% |
| 2023 | 47.79% |
Source: Statista
Mobile internet use continues to grow steadily, with global smartphone traffic increasing 1.23% from 2022 to 2023. The U.S. alone now consumes 10.05 exabytes of mobile data per month, underscoring the surging demand for connectivity.
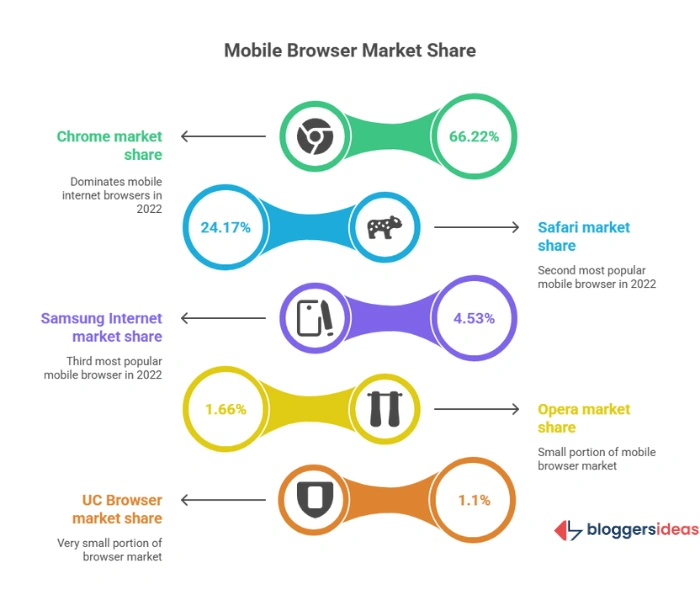
Leading Mobile Internet Browsers (2022)
| Browser | Global Market Share |
|---|---|
| Chrome | 66.22% |
| Safari | 24.17% |
| Samsung Internet | 4.53% |
| Opera | 1.66% |
Mobile Internet Usage: Connecting Billions
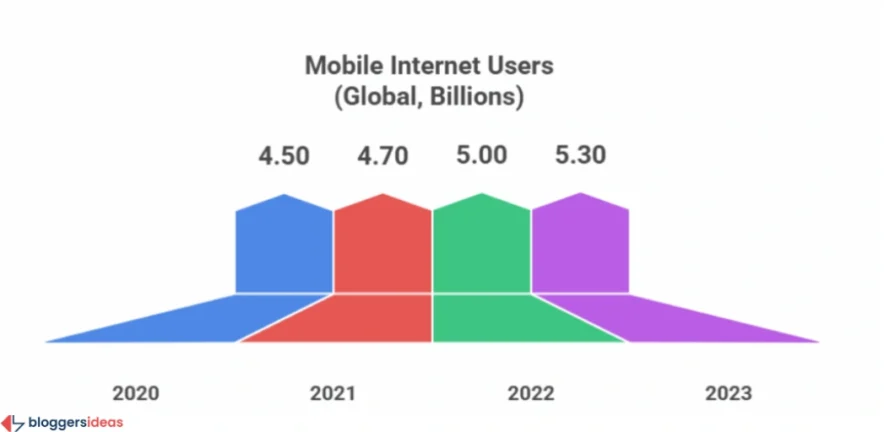
As of 2023, there are 5.3 billion mobile internet users worldwide, accounting for 92.3% of all internet users. This number is projected to reach 5.8 billion by 2026.
| Year | Global Mobile Internet Users (Billions) |
|---|---|
| 2020 | 4.5 |
| 2022 | 5.0 |
| 2023 | 5.3 |
In the U.S., there are 287.5 million mobile internet users, a figure expected to surpass 296 million by 2025.
| Year | U.S. Mobile Internet Users (Millions) |
|---|---|
| 2020 | 270.55 |
| 2023 | 287.5 |
| 2025* | 296.18 |
Source: StatCounter
(*Projected)
Globally, users spend 56.03% of their total online time on mobile devices—a clear sign that smartphones are the preferred medium for accessing the internet.
Also read about: Google Chrome Statistics
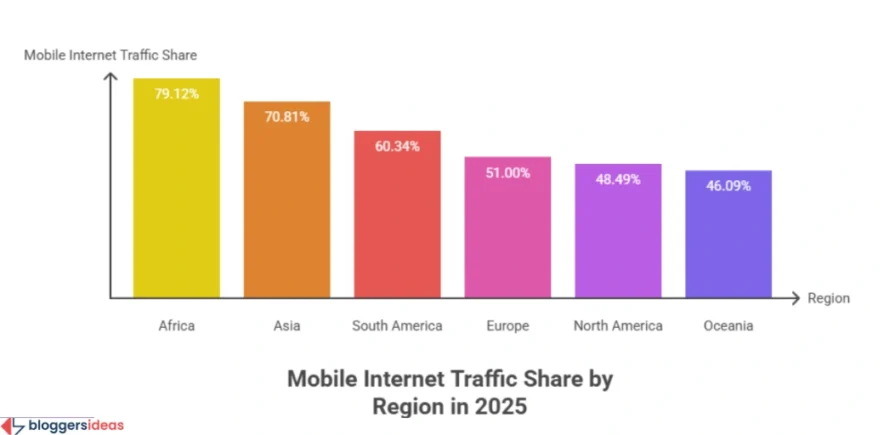
Regional Overview of Mobile Traffic
| Region | Mobile Traffic Share |
|---|---|
| Africa | 79.12% |
| Asia | 70.81% |
| South America | 60.34% |
| Europe | 50.64% |
| North America | 48.49% |
| Oceania | 46.09% |
Among individual countries, Nigeria (83.94%), Turkey (81.97%), and India (75.09%) lead the world in mobile traffic share, reflecting regions where mobile is the primary gateway to the web.
Also read about: Android Usage Statistics
Mobile Device Activity: How People Use Their Phones
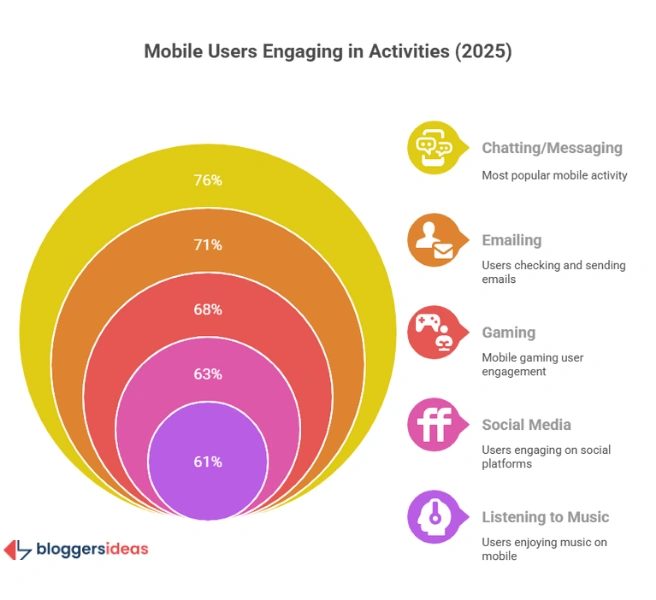
Mobile phones serve as all-in-one tools for communication, entertainment, and productivity.
| Activity | % of Users | Category |
|---|---|---|
| Chatting/Messaging | 76% | Communication |
| Emailing | 71% | Communication |
| Listening to Music | 61% | Entertainment |
| Watching Videos | 61% | Entertainment |
| Buying Products | 56% | E-commerce |
These statistics reveal how deeply integrated mobile devices have become in daily life, with users relying on them for work, shopping, and social engagement.
Also read about: iPhone Users Statistics
Mobile Searches: Finding Information Instantly
Mobile search plays a central role in decision-making.
- 41% of shoppers search for products on mobile while in stores.
- 53% do so at home, and 51% before leaving home.
- 70% of users call businesses directly from Google search results.
With Google handling 96% of all mobile searches, mobile SEO remains vital for online visibility.
M-Commerce: The Power of Mobile Shopping
There are now 2.64 billion online shoppers worldwide, and mobile devices dominate e-commerce traffic. In the U.S., 72% of retail website traffic and 62% of online orders come from mobile devices.
| Year | U.S. Mobile E-commerce Sales (Billions) |
|---|---|
| 2020 | 311.93 |
| 2022 | 431.4 |
| 2025* | 710.42 |
(*Projected)
Mobile commerce now makes up 35.25% of total digital spending in the U.S., making it essential for brands targeting digital-first consumers.
Social Media on Mobile: Connecting the World
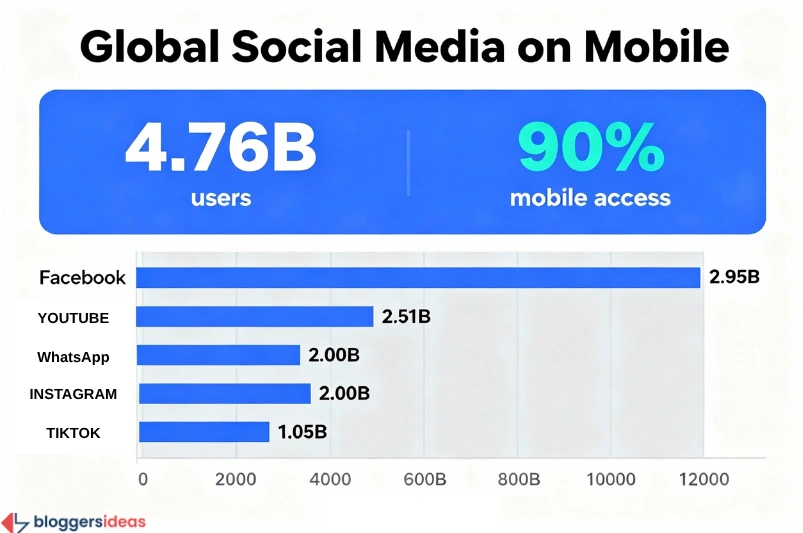
Globally, 4.76 billion people use social media, and over 90% access it via mobile.
| Platform | Monthly Active Users (Billions) |
|---|---|
| 2.95 | |
| YouTube | 2.51 |
| 2.00 | |
| 2.00 | |
| TikTok | 1.05 |
WhatsApp, with 2 billion users, leads messaging apps, followed by WeChat (1.2B) and Facebook Messenger (0.988B).
Email on Mobile: Always Connected
Email remains one of the most consistent uses of mobile devices:
- 333.2 billion emails are sent daily.
- Email opens on mobile rose 180% from 2019–2022.
- 81% of users prefer reading emails on their phones.
Mobile Gaming: A Global Phenomenon
In 2022, there were 3 billion mobile gamers worldwide, accounting for 53% of the total gaming market.
| Game | Downloads (Millions) |
|---|---|
| Stumble Guys | 17.5 |
| Stick War | 15.1 |
| Subway Surfers | 10.1 |
Mobile Broadband Evolution: The Rise of 5G
Mobile broadband continues to evolve rapidly. In 2023, 5G networks handled 31 exabytes of data per month, compared to 84.5 exabytes from 2G–4G combined.
| Year | 5G Data (Exabytes) | 4G and Below (Exabytes) |
|---|---|---|
| 2020 | 1.7 | 47.2 |
| 2022 | 15.2 | 74.8 |
| 2023 | 31 | 84.5 |
| 2025* | 79.2 | 104.4 |
(*Projected)
By 2025, over 1 billion 5G connections are expected globally. The U.S. will see 68% of users on 5G, while China will lead with 866 million connections.
| Country | 2025 5G Connections (Billions) |
|---|---|
| China | 0.86 |
| United States | 0.24 |
| Japan | 0.13 |
| Germany | 0.07 |
User Concerns: Insights from Quora and Reddit
Online discussions reveal three major themes among mobile users:
- Privacy and Security – Users worry about data tracking, public Wi-Fi safety, and app permissions.
- Performance Optimization – Many seek ways to extend battery life and improve network speed.
- Digital Wellness – “Digital detox” conversations reflect growing awareness of screen-time balance.
FAQs About Mobile Internet Traffic Statistics
1. How much internet traffic comes from mobile devices globally and in the U.S.?
Globally, 60.67% of internet traffic comes from mobile devices. In the U.S., mobile accounts for 47.79% of total online traffic.
2. Which activities do people most frequently perform on their phones?
Most users (76%) chat or text, while 71% use their phones for email—showing communication remains the top activity.
3. What factors contribute most to mobile data consumption?
Social media and streaming apps like Facebook, Netflix, and Spotify use the most data due to constant content streaming.
4. How is 5G expected to impact mobile traffic by 2025?
5G will drive over 1 billion connections globally, offering faster speeds, lower latency, and more data-heavy app usage.
5. What concerns do users have about mobile internet use?
Users worry about privacy, data security, and battery performance, while many also discuss digital detox and screen-time balance.
Also Read:
- Pinterest Statistics
- Android Usage Statistics
- Most Google Searched Things Statistics
- Voice Search Statistics
- TikTok User Statistics
Conclusion: Embracing a Mobile-First Future
Mobile devices now power over 63% of global internet traffic, reshaping everything from shopping to entertainment. With billions relying on smartphones daily and 5G expanding rapidly, the mobile-first era is here to stay.
Understanding these Mobile Internet Traffic Statistics 2025 helps individuals and businesses adapt to a digital world defined by connectivity, convenience, and constant evolution.