X (formerly known as Twitter) continues to reinvent itself in 2025—shifting from a microblogging platform to a broader “everything app” under Elon Musk.
With features like payments, video calls, and creator monetization in focus, X remains central to real‑time conversations, news and marketing strategies. Despite bumps in advertiser sentiment and competition from rivals, its user base, revenue dynamics and engagement trends offer valuable insights.
If you’re a brand, creator or marketer looking to leverage X in 2025, these stats and takeaways provide the context you need to act smart.
Key X Statistics: 2026 Highlights
Here are the top numbers to know:
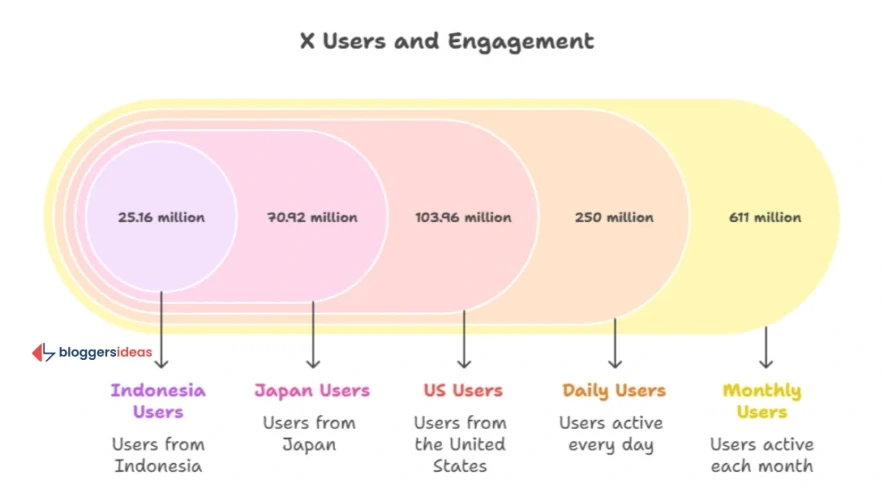
- Monthly Active Users (MAUs): Approximately 611 million globally in 2025, ranking X as the 12th largest social platform.
- Daily Active Users (mDAUs): Around 245–250 million monetizable daily active users, with average time spent of 34 minutes per day.
- Revenue: Reported revenue of $2.5 billion in 2024, with projections of between $2.99 billion and $3.14 billion in 2025.
- Ad Revenue share: Ads account for around 68% of total revenue.
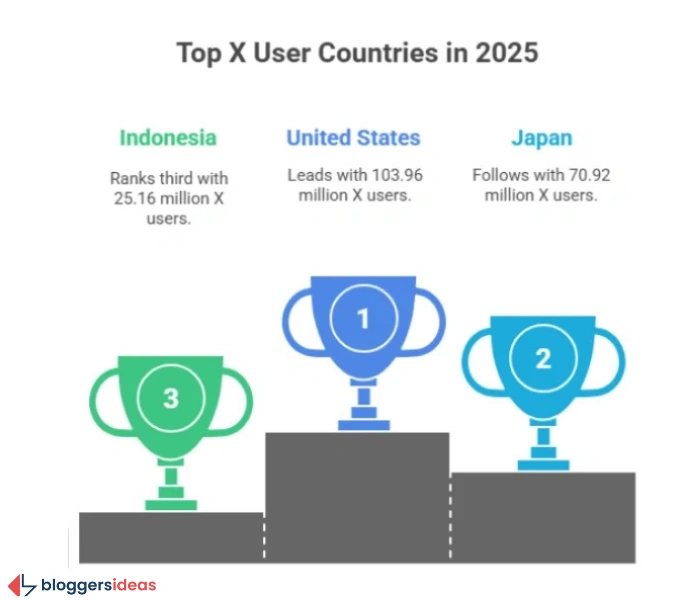
- Top markets: U.S. leads with ~ 103.96 million users, followed by Japan (~70.92 million) and Indonesia (~25.16 million).
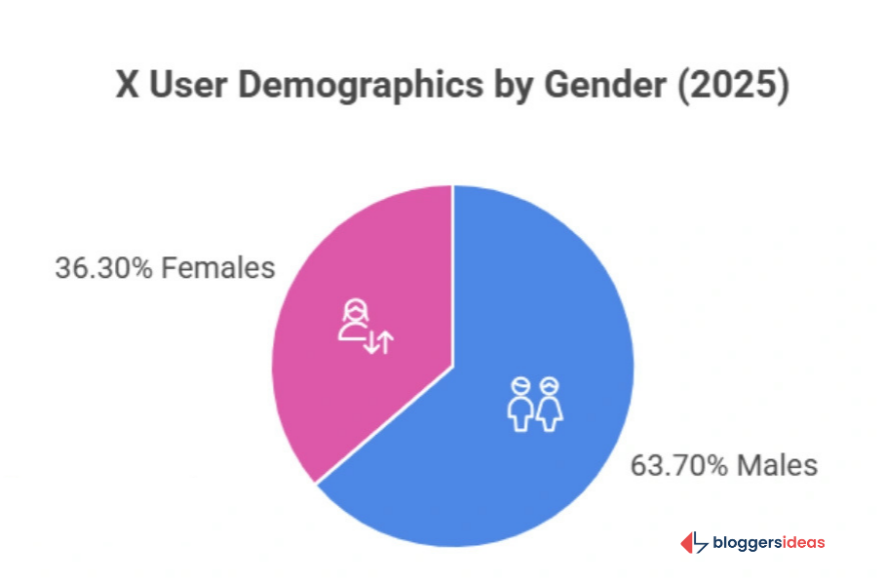
- Demographics: ~63.7% male users; ~37.5% aged 25‑34.
- Content trends: Users watch large‑volume videos; the platform hosts around 500 million posts daily.
- Engagement: Median engagement per post for brands sits at ~0.015%; top performing brands hit ~0.08%.
- Advertising cost: Engagements cost around $0.26–$1.50, making X a relatively cost‑effective platform for some brands.
These numbers let you locate opportunities—such as targeting 25‑34 year‑olds, video content alignment or real‑time service strategies.
Also read about: Facebook Users Statistics
X Users Statistics 2026
The user base of X shows both resilience and change. While some metrics reflect slight declines, there’s still strong global presence and platform stickiness.
Monthly Active Users
An overview of MAU growth:
| Year | Monthly Active Users (Millions) | Change |
|---|---|---|
| 2022 | 368 | – |
| 2023 | 541 | +47% |
| 2024 | 619 | +14.4% |
| 2025 | 611 | –1.3% |
While there is a slight drop from 2024 to 2025, the overall footprint remains significant.
Active Users by Country
In 2025, key national breakdowns:
- United States: ~103.96 million users
- Japan: ~70.92 million users
- Indonesia: ~25.16 million users
- India: ~24.09 million users
- United Kingdom: ~22.87 million users
Notably, the EU region saw user losses (~11 million over five months) while Turkey registered ~22.3% growth.
How to Use This
Brands: Focus ad spend on U.S. and Japan for high‑value audiences.
Creators: Explore emerging markets like Indonesia for growth opportunities as competition is lower and monetization potential remains high.
Source: Statista
Demographics Statistics 2026
Gender & Age Distribution
- Male users: ~63.7%
- Female users: ~36.3%
Age breakdown:
| Age Group | Share (%) |
|---|---|
| 13‑17 | ~2% |
| 18‑24 | ~32.1% |
| 25‑34 | ~37.5% |
| 35‑49 | ~21.1% |
| 50+ | ~7.3% |
User Behavior & Use Cases
- ~48% of users engage for news, ~48% for entertainment; ~34% connect with friends/family; ~14% use X for professional networking.
- In the U.S., ~27% of users are college graduates and ~51% earn over $70,000 annually.
Marketing Implications
- For consumer‑tech or B2B brands, targeting males 25‑34 makes sense.
- Content that emphasizes “news, insights or trends” resonates well—especially since 67% of users say they prefer brands aligned with current events.
- Creators can lean into “professional networking” on X: ~14% of users use it for brand‑research or business purposes.
Also read about: Surprising Instagram Statistics
Revenue Statistics 2026
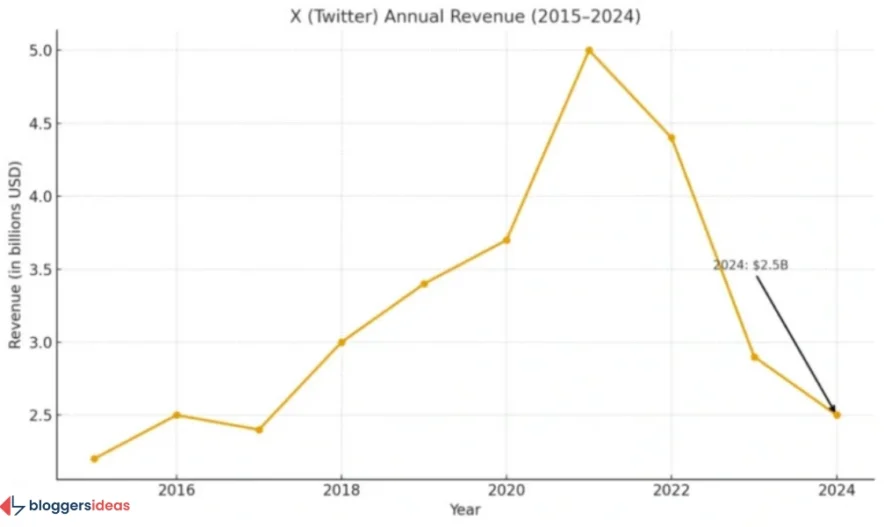
Overall Revenue
- 2024: ~$2.5 billion (decline from prior years) DemandSage+1
- 2025 (projected): ~$2.99 billion to $3.14 billion (+19.6%) Proxidize+1
Revenue by Region & Source
- U.S. ad revenue in 2025 expected to rise ~17.5% to ~$1.31 billion. Reuters+1
- Ads are ~68% of total revenue; non‑ad sources (subscriptions, data licensing) are smaller.
- Revenue per user remains low compared to competitors (~$5.36 per user annually) Proxidize
Advertising Dynamics
- Cost per engagement (CPE): ~$0.26–$1.50.
- Video ads ~64% of ad revenue share.
- Influencer marketing prices:
- Nano (1k‑10k) ~ $11/post
- Micro (10k‑50k) ~ $60/post
- Macro (100k‑1M) ~ $1,500/post
Business Notes
Advertisers can access cost‑effective reach on X, especially for brand awareness. But advertiser trust and brand safety remain issues—data show ~26% of advertisers plan to cut spend due to concerns.
Also read about: YouTube Statistics
Engagement & Usage Statistics 2026
Time Spent & Usage Intensity
- Users spend on average 34 minutes and 6 seconds daily.
- Monthly visits reach ~4.4 billion.
Posts & Content Activity
- ~500 million posts every day (~360,000 posts per minute).
- Engagement: Low median (~0.015%) but top brands achieve ~0.08%.
- Best times to post: Tuesdays to Thursdays, 9 a.m.–3 p.m. — get up to ~21% more engagement when hashtags are used.
Content Types Performance
- Short video content returns higher reach and CTR.
- Text posts still perform reliably for news/insights.
- Customer‑service and brand interaction posts see ~53% of users contacting brands on X; 78% recommend brands post positive service interactions.
Strategic Implications
- Posting ~4 times/week yields better reach than daily flooding.
- Use hashtags and trending topics—brands see ~21% boost in reach.
- Use video reels and short clips to capture modern users.
- Use chat/service features to convert support into loyalty.
Advertising & Influencer Insights
Ad Reach & Cost
- Reach: 563–586 million users accessed via promoted content.
- Cost per engagement is significantly lower than many platforms—makes it attractive for testing.
- Carousel ad formats yield ~35% higher clicks compared to single ad units.
Influencer Marketing
- Brands leveraging influencers on X can capture high recall (~70%) by joining trending conversations or live‑events.
- Ensure influencer content aligns with “real‑time” discussion culture on X for optimal effect.
Competitive Context
X remains significant but faces strong competition and headwinds.
| Platform | MAUs (2025 est.) |
|---|---|
| ~3,070 million | |
| YouTube | ~2,500 million |
| ~2,400 million | |
| ~2,350 million | |
| TikTok | ~1,580 million |
| X | ~611 million |
While far smaller than the giants, X’s niche strength lies in timely news, public figures, and live‑events.
Competitive Notes
- Threads (Meta) is gaining traction and is reported to have ~115 million daily users in June 2025 compared to X’s ~132 million—indicating a narrowing margin. New York Post
- X’s valuation and investment structure (now merged with xAI) signal long‑term bets on integration with AI and real‑time interactivity. Le Monde.fr
Fresh Community Insights: Reddit & Quora
- Reddit users in r/technology note that while U.S./UK users have declined (some estimate a 15% drop), core power‑users remain active.
- On Quora, many ask whether X still serves as a top “news” app. ~59% of users say they use X for news updates.
- Concerns persist: brand safety, algorithm changes and analytics inconsistencies are recurring topics.
- On r/socialmedia, users highlight how smaller creators are getting squeezed—reach is decreasing unless posts are timely and trend‑aware.
How to Use X Statistics 2025 for Your Benefit
For Businesses
- Leverage the ~25–34 year‑old segment with news‑driven content and limited daily posts (~4 per week).
- Use cost‑efficient ads (CPE ~$0.26–$1.50) for niche or regional targeting.
- Use customer‑service or live‑event content to engage real‑time—brands who respond within 3 hours retain ~78% of audiences.
- Explore emerging markets (Indonesia, Turkey) where user growth is stronger and competition lower.
For Creators
- Build around commentary, niche interests or real‑time events—X rewards “live” presence.
- Join the ad‑revenue sharing program (80,000+ creators since 2023) and link to subscriptions or services.
- Collaborate with brands to leverage influencer posts (~$60 micro‑influencers offer ROI ~4x).
For Individuals or Professionals
- Use X for networking: ~14% of users use X for professional brand or research purposes.
- Stay active during news cycles and trending topics—timeliness matters.
- Follow major influencers (e.g., Elon Musk 225.5 M, Barack Obama 130.6 M) to stay plugged into broader conversations.
FAQs About X Twitter Statistics
1. How many monthly active users does X have in 2025?
About 611 million MAUs globally (2025), slightly down from previous year.
2. What is X’s revenue projection for 2025?
Projections estimate $2.99 billion to $3.14 billion, with ad revenue expected to grow ~16.5–17.5%.
3. Is X losing users in 2025?
Yes, slight declines in some regions (EU/US), but growth in others (Turkey, Indonesia) helps offset.
4. What content performs best on X?
Short, timely video and text posts around current events yield better engagement (~0.42% for video influencers) than static posts.
5. How can advertisers tap into X’s statistics for marketing in 2025?
By targeting 25–34 year‑olds, paying attention to posting times (Tue‑Thu, 9 a.m.–3 p.m.), using hashtags (boost ~21%), and leveraging lower CPE rates for niche campaigns.
Also Read:
- Grok AI Statistics
- Smartphone Usage Statistics
- Social Media Usage Statistics
- Generative AI Statistics
- Quick Commerce Statistics
Conclusion
The 2025 snapshot of X presents a platform that’s evolved beyond its Twitter roots—still vital, though challenged. With ~611 million users globally, daily time spent of ~34 minutes, and projected revenue of nearly $3 billion, it retains major relevance. Its strengths lie in real‑time conversation, public figure presence and lower‑cost advertising.
While competition is high, and advertiser trust wobbles, brands and creators who align with its fast‑moving culture can win. For users, it remains one of the go‑to platforms for news, commentary and networking. The future: continued integration of AI, commerce and content that rewards immediacy.
Use these 2025 statistics not just as numbers, but as guidance—where to post, whom to target and what forms of content convert. Your next viral moment or lead may just start with the right tweet—or “X post.”