Influencer marketing has completed its evolution from a novelty tactic to a core component of the modern marketing mix. What began as brands paying celebrities to post photos has become a $32.6 billion global industry with standardized ROI benchmarks, sophisticated fraud detection tools, professionalized creator economics, and a growing B2B subcategory expanding at 47% per year. The industry has grown 19x since 2016 — and it is not finished growing.
The data in 2026 tells a particularly compelling story about where the ROI actually lives: not with mega-celebrities but with micro and nano-creators who command higher engagement, stronger audience trust, lower costs, and better conversion rates. Understanding this distinction — and the full data landscape that surrounds it — is the foundation of any effective influencer strategy in 2026.
Industry Size and Growth: The Numbers That Establish the Stakes
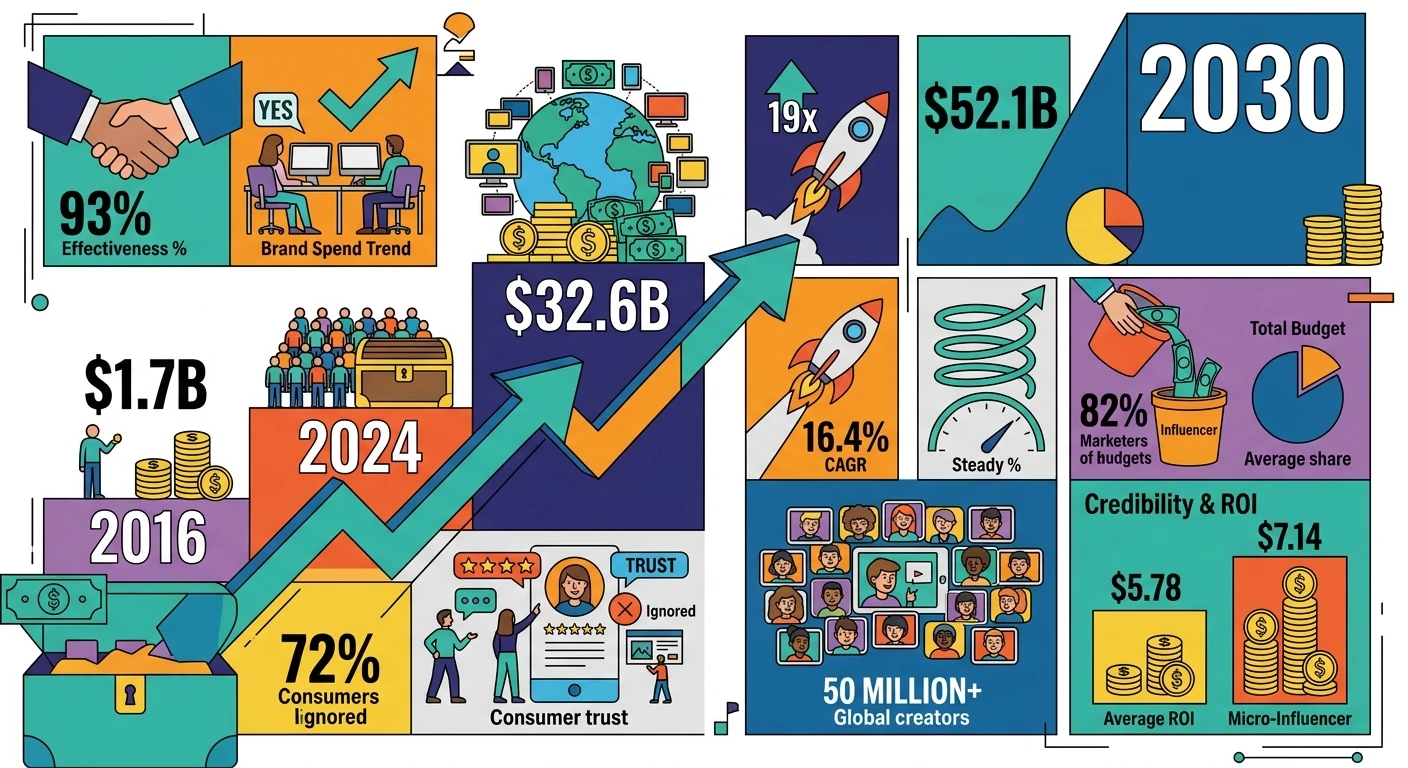
$32.6 billion — global influencer marketing industry size in 2026
19x market expansion since 2016 (from $1.7B to $32.6B)
16.4% compound annual growth rate (CAGR) from 2021–2026
$52.1 billion — projected industry size by 2030
$24 billion — industry size in 2024 (36% growth in just two years)
82% of marketers now allocate a dedicated influencer marketing budget
17.4% — average share of total marketing budget allocated to influencer campaigns
63% of brands plan to increase influencer spend in 2026
93% of marketers who have used influencer marketing say it is effective
72% of consumers trust influencer recommendations over traditional brand advertising
50 million+ active creators globally across all platforms
The industry’s credibility has been earned through measurable results. At $5.78 average return per dollar spent, influencer marketing delivers one of the highest ROIs in digital marketing — and the variance between categories (micro-influencers outperforming at $7.14 per dollar) is creating clear strategic direction for brands willing to look at the data.
ROI and Performance Benchmarks
The ROI data for influencer marketing is now mature enough to disaggregate by tier, platform, and category — making it possible to build precise, evidence-based budget models.
ROI by Influencer Tier:
Influencer Tier | Followers | Average ROI per $1 Spent |
Nano-influencers | 1K–10K | $6.52 |
Micro-influencers | 10K–100K | $7.14 (highest) |
Mid-tier influencers | 100K–500K | $5.18 |
Macro-influencers | 500K–1M | $4.23 |
Mega-influencers | 1M+ | $3.42 |
Celebrity influencers | 10M+ | $2.87 (lowest) |
Additional ROI data points:
$5.78 average return across all influencer tiers and platforms
11x — top campaign ROI, found in beauty and fitness categories
2.18% average conversion rate for influencer-driven traffic
49% of consumers have made a purchase based on an influencer recommendation
8.7x more cost-effective than display advertising on a CPM basis
37% higher customer retention rate for influencer-acquired customers vs. other channels
61% of top-performing campaigns use always-on ambassador strategies (vs. single campaign bursts)
Micro vs. Macro vs. Mega: The Complete Comparison
The engagement rate advantage of smaller influencers is well-established, but the 2026 data adds critical commercial dimensions — conversion rates, audience authenticity, and brand safety scores — that make the case for micro and nano-influencers even stronger:
Metric | Nano (1K–10K) | Micro (10K–100K) | Macro (500K–1M) | Mega (1M+) |
Avg. Engagement Rate | 4.84% | 3.86% | 1.64% | 1.21% |
Avg. Cost Per Post | $50–$250 | $250–$1,250 | $5K–$10K | $10K–$50K+ |
Conversion Rate | 2.41% | 2.18% | 1.42% | 0.91% |
Cost Per Engagement | $0.14 | $0.18 | $0.82 | $1.67 |
Avg. ROI per $1 | $6.52 | $7.14 | $4.23 | $3.42 |
Audience Authenticity | 94.2% | 91.7% | 82.4% | 76.1% |
Brand Safety Score | 91/100 | 88/100 | 79/100 | 72/100 |
The numbers make a clear case: micro-influencers deliver 3.2x higher engagement than mega-influencers at 60% lower cost per post, with a 2.4x higher conversion rate. They also have meaningfully higher audience authenticity and brand safety scores — important risk management considerations as fraud detection becomes more sophisticated.
That said, macro and mega-influencers serve specific functions that smaller creators cannot replace:
84% of major product launches still use macro/mega influencers for reach
Mega-influencer posts achieve 4.1x greater reach per post than micro-influencers
Mega-influencer campaigns produce 67% higher brand recall
92% of brands combine micro and macro in blended strategies
The most effective influencer programs in 2026 are blended: macro/mega for awareness and brand recall, micro/nano for engagement, conversion, and cost efficiency. 78% of successful influencer campaigns involve micro-influencers as a core component.
Platform-by-Platform Influencer Performance
Platform selection is as important as influencer tier selection. Engagement rates, costs, and content lifespan vary significantly by platform:
Influencer Engagement Rates by Platform:
Platform | Avg. Influencer Engagement Rate |
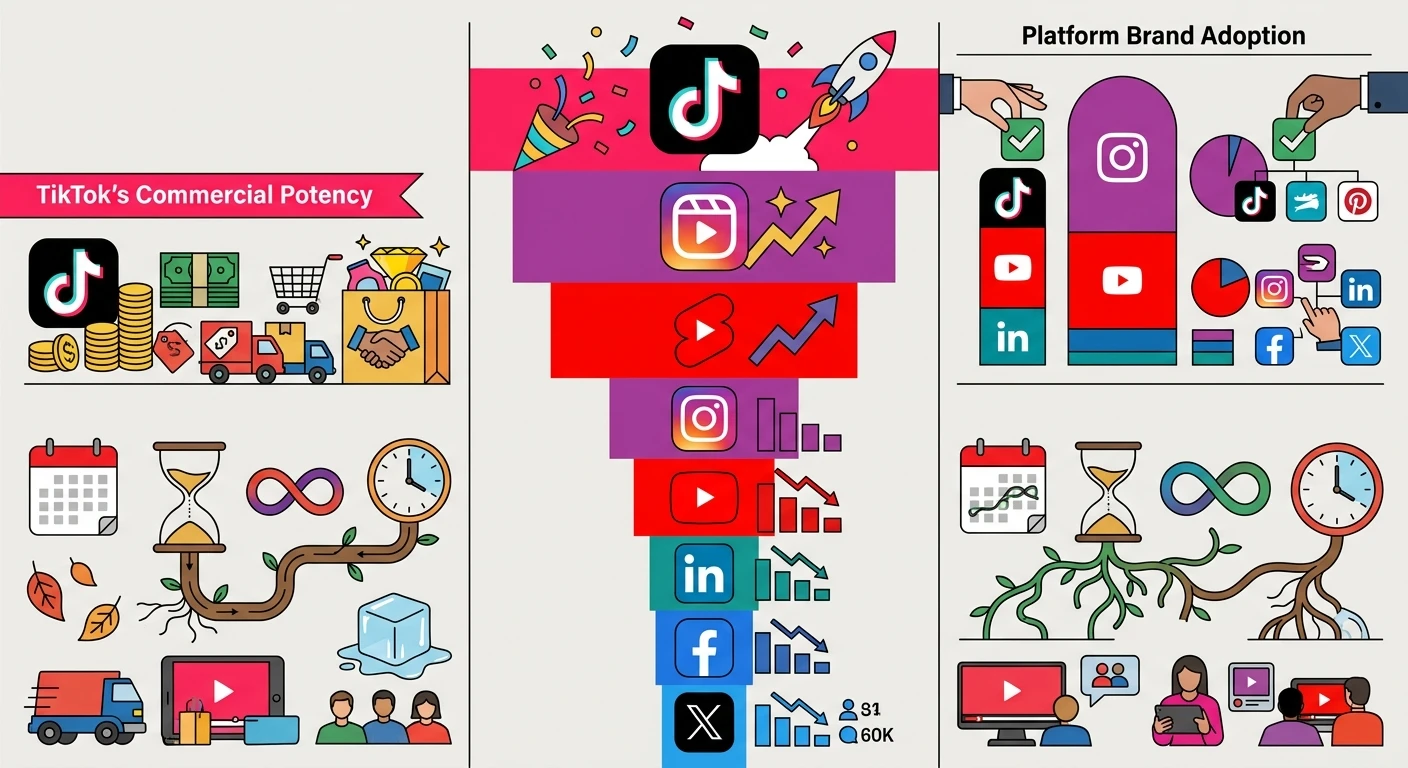
TikTok | 5.53% (highest) |
Instagram Reels | 3.74% |
YouTube Shorts | 3.21% |
Instagram Feed | 1.84% |
YouTube Long-Form | 1.63% |
1.47% | |
0.82% | |
Twitter/X | 0.71% |
Platform Brand Adoption for Influencer Campaigns: Instagram leads at 67% adoption rate, followed by TikTok (56%), and YouTube (51%). LinkedIn is used by just 18% of brands for influencer campaigns — despite being the highest-value channel for B2B.
TikTok’s 5.53% average influencer engagement rate (the highest of any platform), combined with its $33.1 billion TikTok Shop GMV powered heavily by influencer commerce, makes it arguably the most commercially potent influencer marketing channel currently available. YouTube, meanwhile, offers 2.7x longer content lifespan than short-form platforms — a significant consideration for evergreen campaign ROI.
Creator Pricing Benchmarks (Micro-Influencer, 10K–100K Followers)
Format | Price Range |
Instagram Reel | $250–$1,250 |
Instagram Story | $100–$500 |
TikTok Video | $200–$1,000 |
YouTube Video | $1,000–$5,000 |
YouTube Short | $200–$800 |
LinkedIn Post | $500–$2,500 |
Blog Post/Review | $300–$1,500 |
Podcast Mention | $500–$3,000 |
Creators with proven sales attribution command a 2.1x pricing premium over equivalently-sized creators without this track record. The shift toward performance-based compensation means 73% of brands are moving toward commission/affiliate models that tie payment to measurable outcomes — which is driving a rapid expansion of affiliate and commission income, now representing 34% of total creator revenue and growing fastest of any revenue stream.
B2B Influencer Marketing: The Fastest-Growing Subcategory
B2B influencer marketing is the most underexploited and fastest-growing segment in the industry, expanding at 47% year-over-year with $4.1 billion in spend in 2026.
11x ROI vs. traditional digital advertising for enterprise SaaS
58% shorter sales cycle when B2B prospects are exposed to influencer content
71% of B2B buyers are influenced by thought leaders in their purchase decisions
3.2x higher lead quality from B2B influencer campaigns vs. paid social
43% of B2B brands now use employee advocacy as an influencer strategy
86% of B2B marketers plan to increase influencer budgets in the next 12 months
B2B Influencer Channels by Adoption:
Channel | Brand Adoption |
78% | |
Twitter/X | 42% |
YouTube | 38% |
Podcasts | 34% |
Industry blogs | 31% |
Webinars/events | 27% |
Newsletter sponsorships | 24% |
Influencer Fraud Statistics: The Hidden Tax on Performance
Influencer fraud — fake followers, artificial engagement, and misrepresented metrics — remains a significant challenge despite improving detection technology:
$1.3 billion in estimated annual losses to influencer fraud globally
14.2% of influencer accounts show signs of artificial follower inflation
22.8% of engagement on sponsored posts involves inauthentic interaction
48% of brands report having been affected by influencer fraud
Fraud rates vary significantly by platform: X/Twitter (21.3%) and Facebook (19.1%) have the highest fraud rates, while LinkedIn (6.2%) and YouTube (9.7%) are the cleanest platforms
The fraud impact on campaign performance:
47% lower true engagement rate for accounts with 20%+ fake followers
62% lower conversion rate vs. verified authentic accounts
3.1x higher cost-per-acquisition for brands partnering with fraudulent accounts
Despite this, 94% accuracy of AI-powered fraud detection tools means the problem is manageable for brands investing in verification: 67% lower fraud exposure for brands using third-party verification platforms. 79% of enterprise brands now use fraud detection tools.
Campaign Performance by Industry
Industry | Avg. Engagement | Avg. ROI per $1 | YoY Growth |
Beauty and Cosmetics | 3.87% | $8.21 | +11% |
Health and Fitness | 4.12% | $7.56 | +18% |
Fashion and Apparel | 3.21% | $6.84 | +14% |
Financial Services | 1.62% | $6.32 | +38% |
Food and Beverage | 3.54% | $5.94 | +16% |
Gaming | 4.47% | $5.83 | +22% |
Technology | 1.94% | $4.67 | +31% |
Automotive | 2.14% | $4.91 | +24% |
Financial services and technology have the lowest engagement rates but are among the fastest-growing adopters and deliver strong ROI because the average deal size justifies the investment. Gaming has the highest engagement rate (4.47%) of any industry category.
FAQs
The average ROI for influencer marketing in 2026 is $5.78 for every $1 spent across all tiers and platforms. Micro-influencers lead performance with $7.14 per dollar, while beauty and fitness campaigns at peak can reach an 11x return.
Yes, by most key performance metrics — micro-influencers deliver 3.2x higher engagement, 2.4x higher conversion rates, and a $7.14 ROI compared to $2.87 for celebrity influencers. That said, mega-influencers offer 4.1x greater reach and 67% higher brand recall, so blended strategies tend to perform best.
TikTok leads all platforms with a 5.53% average engagement rate and $33.1 billion in TikTok Shop GMV, making it the top choice for creator commerce. Instagram dominates brand adoption at 67%, while YouTube provides the longest content lifespan — 2.7x longer than short-form platforms — ideal for evergreen campaigns.
Influencer fraud costs the industry an estimated $1.3 billion annually, with 22.8% of sponsored engagement flagged as inauthentic. Using third-party fraud detection tools reduces exposure by 67%, and prioritizing LinkedIn and YouTube — which have the lowest fraud rates at 6.2% and 9.7% respectively — adds an extra layer of protection.
Yes, B2B influencer marketing is growing at 47% year-over-year and delivers 11x ROI compared to traditional digital advertising for enterprise SaaS. It also shortens sales cycles by 58%, with LinkedIn serving as the primary channel used by 78% of brands running B2B influencer programs.