The Over-The-Top (OTT) industry transforms entertainment in 2026, delivering content directly over the internet and empowering you to watch anytime, anywhere on any device.
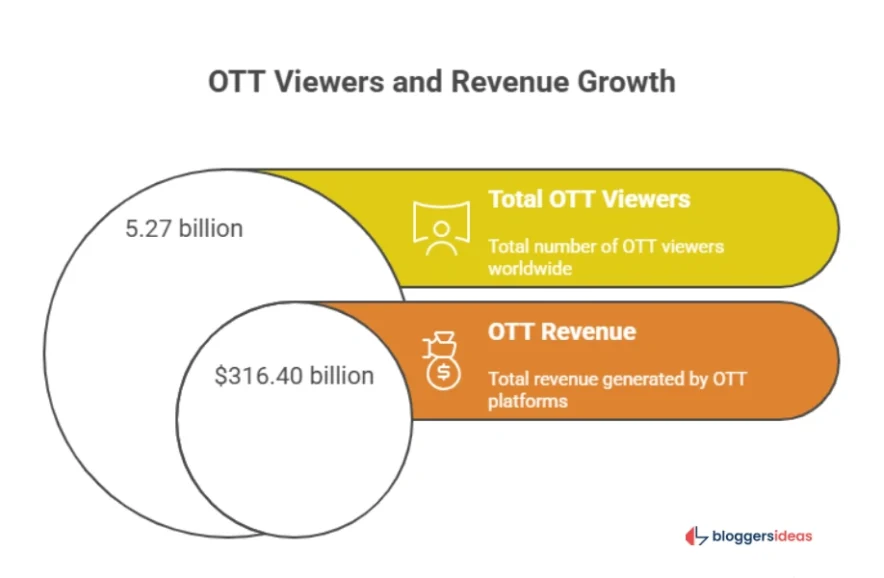
OTT statistics 2026 reveal a massive global audience exceeding 5.27 billion users, generating over $316.40 billion in revenue, as platforms like Netflix, Amazon Prime, and Disney+ dominate with exclusive shows, movies, and live events.
You benefit by cutting cable costs, accessing personalized recommendations, and enjoying ad-supported free tiers that save money while discovering new content.
Rising internet speeds, smart TVs, and mobile penetration drive this growth, with 70% of users binge-watching and spending 17 hours weekly streaming.
Recent Quora users ask how to bundle OTT subscriptions for family sharing to reduce expenses, while Reddit threads in r/cordcutters discuss using VPNs for geo-restricted content and optimizing home networks for 4K streaming without buffering.
This comprehensive article equips you with detailed insights to choose platforms, manage subscriptions, avoid churn, and enhance your viewing experience for ultimate enjoyment and savings.
Global OTT User Base: Massive Adoption Worldwide
OTT reaches an estimated 5.27 billion users globally, up from 3.92 billion in 2024, fueled by affordable data plans and device proliferation.
The COVID-19 pandemic adds nearly 800 million users during lockdowns, accelerating on-demand viewing. Penetration rates climb to 47.83% in 2024, projected to hit 54.7% by 2028.
You capitalize on this by selecting platforms with vast libraries, ensuring endless entertainment options tailored to your tastes.
The table below tracks global OTT users over the years:
| Year | Number of OTT Users |
| 2029* | 4.91 billion |
| 2028* | 4.72 billion |
| 2027* | 4.52 billion |
| 2026* | 4.33 billion |
| 2025 | 4.12 billion |
| 2024 | 3.92 billion |
| 2023 | 3.74 billion |
| 2022 | 3.53 billion |
| 2021 | 3.67 billion |
| 2020 | 3.46 billion |
This surge allows you to stream across smartphones, tablets, and TVs, fitting seamlessly into your busy lifestyle.
Also read about: Netflix Subscriber Statistics
OTT Revenue Growth: A Booming Market
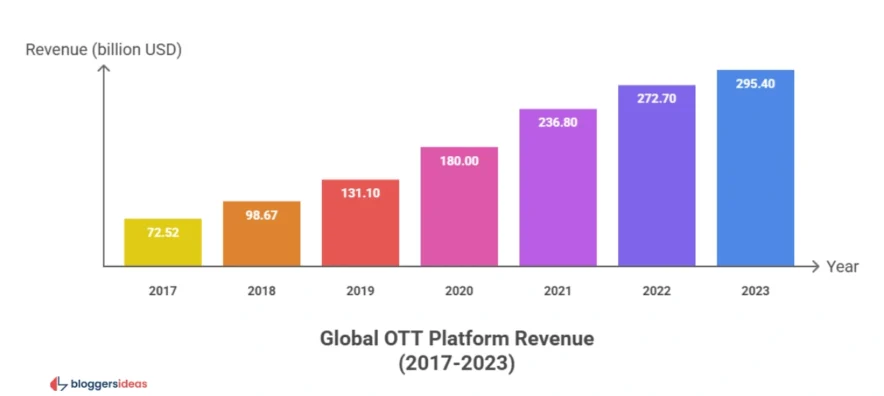
Worldwide OTT revenue hits $316.40 billion in 2025, with $295.40 billion in 2023 and projections to $476 billion by 2027 at a 7.29% CAGR.
Subscription Video-on-Demand (SVOD) leads, but Advertising Video-on-Demand (AVOD) and Free Ad-Supported Streaming TV (FAST) grow rapidly.
Average Revenue Per User (ARPU) reaches $82.7 by early 2025. You save by opting for ad-supported plans, accessing premium content at lower costs.
The table below shows OTT revenue progression:
| Year | Revenue |
| 2023 | $295.40 billion |
| 2022 | $272.70 billion |
| 2021 | $236.80 billion |
| 2020 | $180.00 billion |
| 2019 | $131.10 billion |
| 2018 | $98.67 billion |
| 2017 | $72.52 billion |
Invest in bundled subscriptions to maximize value from this expanding market.
Also read about: 15+ Best Netflix Affiliate Program Alternatives
Market Size and Projections: Exponential Expansion
The OTT market values at $0.45 trillion in 2025, growing to $1.55 trillion by 2028 at a 28.19% CAGR. OTT devices and services reach $306.1 billion by 2025.
North America holds 39% of the content market. You benefit from competitive pricing and innovations like interactive features, enhancing engagement.
The table below forecasts OTT market size:
| Year | Market Size |
| 2028 | $1.55 trillion |
| 2027 | Projected growth |
| 2026 | $372.6 billion (devices/services) |
| 2025 | $0.45 trillion / $306.1 billion |
| 2024 | $251.6 billion (devices/services) |
Plan long-term subscriptions during promotions to lock in savings.
Time Spent Streaming: Deep Engagement Habits
Users average 17 hours weekly on OTT, down slightly from 19 in 2022 but up from 10.5 in 2018. Americans dedicate 70 minutes daily.
Sessions last 20-60 minutes, with 34.97% accessing multiple times daily. You optimize by creating watchlists and using offline downloads for commutes.
The table below details weekly streaming hours:
| Year | Average Hours Weekly |
| 2023 | 17 |
| 2022 | 19 |
| 2021 | 18 |
| 2020 | 16 |
| 2019 | 14 |
| 2018 | 10.5 |
Schedule viewing to balance with real-life activities, preventing burnout.
Penetration Rates: Widespread Accessibility
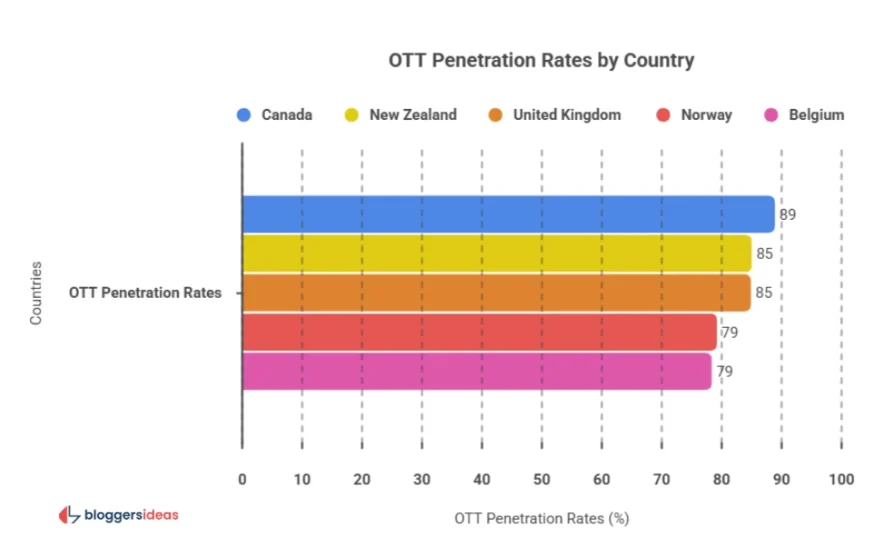
Global penetration hits 47.83% in 2024, with Canada at 89.12% leading. 98% of U.S. households subscribe to at least one service, 75% to two or more.
You join by starting with free trials, exploring content without commitment.
The table below lists top countries by penetration:
| Country | Penetration Rate |
| Canada | 89.12% |
| New Zealand | 85.27% |
| United Kingdom | 85.13% |
| Norway | 79.46% |
| Belgium | 78.6% |
High rates ensure diverse content availability in your region.
Binge-Watching and User Behavior: Immersive Consumption
Over 70% binge-watch, averaging 5 episodes per session. 74.89% access OTT thrice weekly; 86% maintain or add subscriptions. You combat decision fatigue by rotating platforms monthly.
The table below shows subscription intentions:
| Intention | Percentage |
| Maintain Current | 61% |
| Add New | 25% |
| Reduce | 14% |
Use parental controls for family-friendly binge sessions.
Advertising on OTT: Effective and Lucrative
OTT Video Advertising volumes $191.40 billion in 2024, growing 10.3%. Ads achieve 90%+ completion rates; 72% recall specific ads, 66% discover products.
57% prefer ad-supported free/low-cost options. You tolerate ads for free access, multitasking during breaks.
The table below projects advertising revenue:
| Year | Revenue (USD billion) |
| 2025 | 207.50 |
| 2026 | 223.50 |
| 2027 | 239.10 |
| 2028 | 254.00 |
| 2029 | 268.00 |
Skip ads on premium tiers for uninterrupted viewing.
AVOD and FAST Growth: Free Alternatives Rise
AVOD generates $48.32 billion in 2024, FAST $9.62 billion. Users decrease slightly for some AVOD but grow overall. You switch to Tubi or Pluto TV for cost-free entertainment.
The table below tracks AVOD/FAST revenue:
| Year | AVoD (USD billion) | FAST (USD billion) |
| 2025 | 54.54 | 11.68 |
| 2026 | 59.59 | 13.36 |
| 2027 | 63.50 | 14.63 |
| 2028 | 67.40 | 15.53 |
| 2029 | 71.31 | 16.14 |
Combine with SVOD for hybrid viewing.
Platform Market Shares: Competitive Landscape
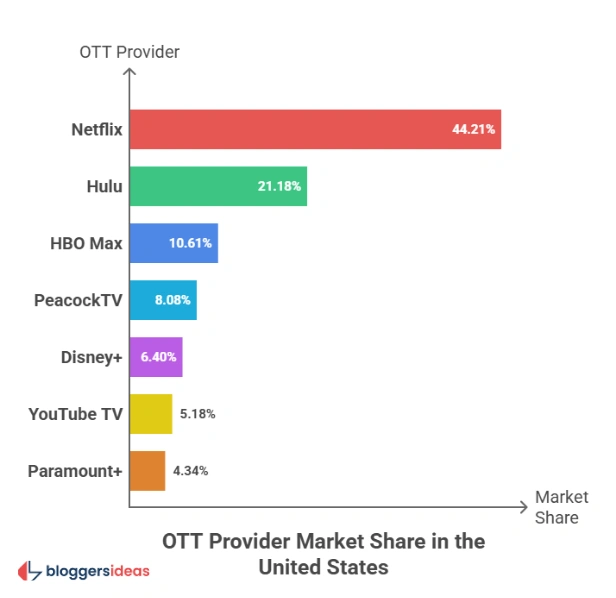
Netflix holds 44.21% in the U.S., followed by Hulu at 21.18%. Globally, Amazon Prime Video leads 18%, Disney+ 15%. You diversify across leaders for comprehensive libraries.
The table below shows U.S. market shares:
| Platform | Market Share |
| Netflix | 44.21% |
| Hulu | 21.18% |
| HBO Max | 10.61% |
| PeacockTV | 8.08% |
| Disney+ | 6.40% |
Monitor shares to predict content availability.
Netflix Dominance: Subscriber and Revenue Leader
Netflix boasts 277 million subscribers in Q2 2024, revenue $33.72 billion in 2023. Ad-tier reaches 15 million. You enjoy originals and global reach.
The table below tracks Netflix subscribers:
| Year | Subscribers (millions) |
| 2024 (Q2) | 277.65 |
| 2023 | 260.28 |
| 2022 | 230.7 |
Upgrade to ad-tier for affordability.
Amazon Prime Video: Bundled Value
Amazon Prime has 200+ million members, revenue $35.22 billion in 2022. You bundle with shopping for extra perks.
The table below shows Prime members:
| Year | Members (millions) |
| 2020 | 200 |
| 2019 | 150 |
Leverage for free shipping alongside streaming.
Hulu Growth: Steady Expansion
Hulu reaches 48.2 million subscribers in 2023, revenue $11.2 billion. You access next-day TV episodes.
The table below details Hulu subscribers:
| Year | Subscribers (millions) |
| 2023 | 48.2 |
| 2022 | 45 |
Pair with Disney+ bundle.
Disney+ Performance: Family-Focused
Disney+ has 150.2 million subscribers in 2023, revenue $8.4 billion. You stream Marvel and Star Wars.
The table below tracks Disney+ revenue:
| Year | Revenue ($ billion) |
| 2023 | 8.4 |
| 2022 | 7.4 |
Ideal for household sharing.
Other Platforms: Emerging Players
Max/Discovery+ at 122.3 million, Paramount+ 79 million, Peacock 41 million. You explore niches like sports on Peacock.
The table below lists select subscribers:
| Platform | Subscribers (millions) |
| Max/WBD | 122.3 |
| Paramount+ | 79 |
| Peacock | 41 |
Regional Insights: Varied Dynamics
U.S. generates $133.70 billion, China $76.60 billion. Asia-Pacific scales mobile-first. You use region-specific apps for local content.
The table below compares top countries:
| Country | Revenue 2024 (USD billion) |
| United States | 133.70 |
| China | 76.60 |
| United Kingdom | 15.95 |
Strategies to Benefit from OTT
Bundle services to cut costs; use multiple profiles for personalization. Download for offline; enable notifications for new releases. Recent Reddit tips include mesh Wi-Fi for buffering, Quora suggests shared accounts ethically.]
FAQs About OTT Statistics
1. How many global OTT users are there in 2025, and how can I join them affordably?
Global OTT users exceed 5.27 billion in 2025, up from 3.92 billion in 2024; you join affordably by starting with free AVOD platforms like Tubi or ad-supported tiers on Netflix, saving on subscriptions while accessing vast content.
2. What is the projected OTT revenue for 2025, and how does it benefit viewers?
OTT revenue projects at $316.40 billion in 2025; this benefits viewers through increased investment in exclusive content, better recommendations, and competitive pricing, allowing you to enjoy high-quality shows at lower costs via bundles.
3. Which platforms lead in subscribers, and how do I choose the best one?
Netflix leads with 277 million subscribers, followed by Amazon Prime at 200+ million and Disney+ at 150.2 million; you choose based on content preferences, like family-friendly on Disney+ or originals on Netflix, trying free trials first.
4. How much time do users spend on OTT weekly, and how can I manage it effectively?
Users spend 17 hours weekly on OTT in 2025; you manage it effectively by setting screen time limits in app settings, prioritizing binge-worthy series, and balancing with offline activities for healthier habits.
5. What advertising trends dominate OTT in 2025, and how do they enhance my experience?
OTT advertising reaches $191.40 billion with 90%+ completion rates; targeted ads enhance your experience by recommending relevant products, and you opt for ad-free premiums or tolerate them for free access to premium libraries.
Also Read:
- WhatsApp Statistics
- Zoom Statistics
- Meta AI Statistics
- Video Marketing Statistics
- Apple Music Statistics
Conclusion
OTT statistics 2025 highlight 5.27 billion users, $316.40 billion revenue, and leaders like Netflix with 277 million subscribers, enabling you to enjoy flexible, cost-effective streaming that fits your life perfectly.