Business owners and marketers actively seek reliable ways to reach customers, generate leads, and increase sales in a competitive digital landscape.
Google Ads delivers proven results as the leading PPC platform, commanding an 80.20% market share and helping businesses earn $2 for every $1 spent.
These Google Ads statistics 2025 highlight why the platform reaches 4.77 billion users worldwide, with 63% of people clicking on ads and Shopping Ads capturing 85.3% of clicks in their campaigns.
You benefit directly by understanding these metrics—whether you run a startup, small business, or enterprise—and applying them to optimize campaigns for higher conversions, lower costs, and sustained growth.
This comprehensive guide merges key data from industry reports, analyzes over 16,000 campaigns from April 2024 to March 2025, and incorporates fresh insights from Quora and Reddit discussions to equip you with actionable strategies.
You discover how to leverage AI, mobile trends, and Performance Max to outperform competitors and achieve up to 200% ROI.
Dominance and Market Reach of Google Ads in 2026
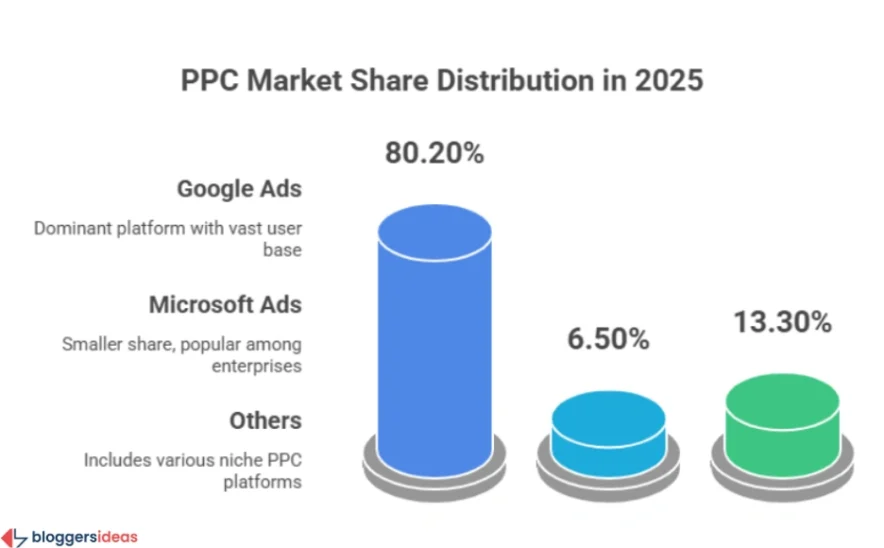
Google Ads solidifies its position as the PPC powerhouse in 2025, holding an 80.20% market share that outpaces all competitors.
Businesses worldwide rely on the platform, with 80% incorporating it into PPC strategies and 65% of small to mid-sized companies actively running campaigns.
Over 1.2 million businesses and 96% of brands invest in Google Ads, recognizing its ability to connect with intent-driven searchers.
The platform reaches 90% of global internet users—approximately 4.77 billion people—through search, display, YouTube, apps, and partner sites.
YouTube alone boasts 2.7 billion users, representing 51% of the internet base, while the Google Display Network includes over 2 million websites and serves 2 trillion impressions monthly to 2.5 billion users.
Mobile drives engagement, with 61.9% of clicks originating from smartphones and 63% from mobile devices overall. Google captures 95% of paid mobile clicks and 64% of mobile searches, making it essential for on-the-go consumers.
Brand awareness surges 46% via mobile ads, and 60% of smartphone users contact businesses directly using features like click-to-call.
You capitalize on this by prioritizing responsive ads, as 84% of businesses favor them for seamless experiences across devices.
| Key Reach Metric | Value in 2025 |
| Market Share | 80.20% |
| Global Reach | 90% (4.77 billion users) |
| Mobile Clicks | 61.9% |
| Display Network Sites | Over 2 million |
| Monthly Impressions | 2 trillion |
Source: Statista
Revenue Growth and Financial Impact of Google Ads
Google’s ad revenue reflects robust demand, generating $237.855 billion in 2023, up from $224.473 billion in 2022 and $209.49 billion in 2021.
The decade-long growth reaches 365.74%, with projections hitting $81 billion in Google Ads-specific revenue for 2025.
Businesses see direct returns: the average ROI stands at 200%, meaning $2 earned per $1 spent.
Paid ads boost brand awareness by 33%, and 43% of users purchase after viewing an ad. Millennials lead with 58% buying due to online ads, while 59% use mobile shopping to decide brands.
| Year | Google Ads Revenue (Billion USD) |
| 2023 | 237.855 |
| 2022 | 224.473 |
| 2021 | 209.49 |
| 2020 | 146.92 |
| 2019 | 134.81 |
| 2018 | 116.46 |
| 2017 | 95.58 |
| 2016 | 79.38 |
| 2015 | 67.39 |
| 2014 | 59.62 |
| 2013 | 51.07 |
Source: eMarketer
You track ROI by assigning values to conversions, ensuring campaigns align with revenue goals. 79% of marketers view PPC as vital, and professional management costs 12-30% of ad spend ($350-$5,000 monthly).
Also read about: Google Chrome Statistics
Click-Through Rates and Engagement Metrics Across Networks
The average CTR for Google Search Ads reaches 3.17%, with top-position ads at 7.94%. Overall platform CTR hits 4.6%, but industry variations exist.
The Search Network averages 6% conversion but 91% CTR in some analyses—focus on intent keywords for precision.
Display Network CTR stands at 0.35%, with CPC under $1. Shopping Ads achieve 0.86% CTR, driving 85.3% of clicks in retail campaigns.
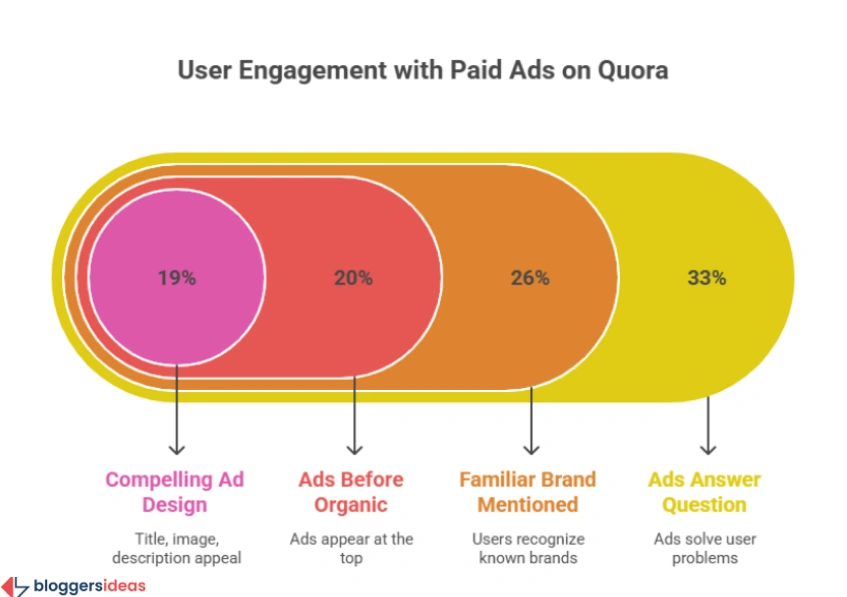
Reasons for clicks include:
| Reason for Clicking Ads | Percentage |
| Answers a Question | 33% |
| Familiar Brand | 26% |
| Listed Before Organics | 20% |
| Compelling Elements | 19% |
61.9% of clicks come from mobile, and 63% of users click paid results. 75% say ads ease searches, and 66% prefer online shopping.
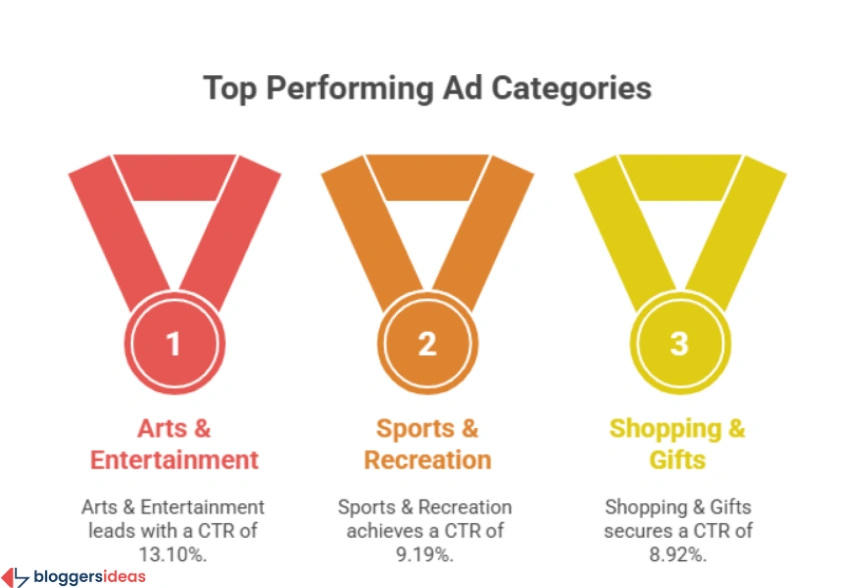
You boost CTR by using ad assets like sitelinks, testing buzzwords, and aligning with high-intent queries. Overall average CTR in 2025: 6.66%, up 3.74% YoY.
| Industry | Average CTR 2025 |
| Arts & Entertainment | 13.10% |
| Sports & Recreation | 9.19% |
| Shopping & Gifts | 8.92% |
| Real Estate | 8.43% |
| Finance & Insurance | 8.33% |
| … (lowest: Dentists) | 5.44% |
52% of industries saw CTR decreases due to SERP blending, but you counter with AI-generated copy and image assets.
Also read about: Most Google Searched Things Statistics
Conversion Rates and Industry Benchmarks
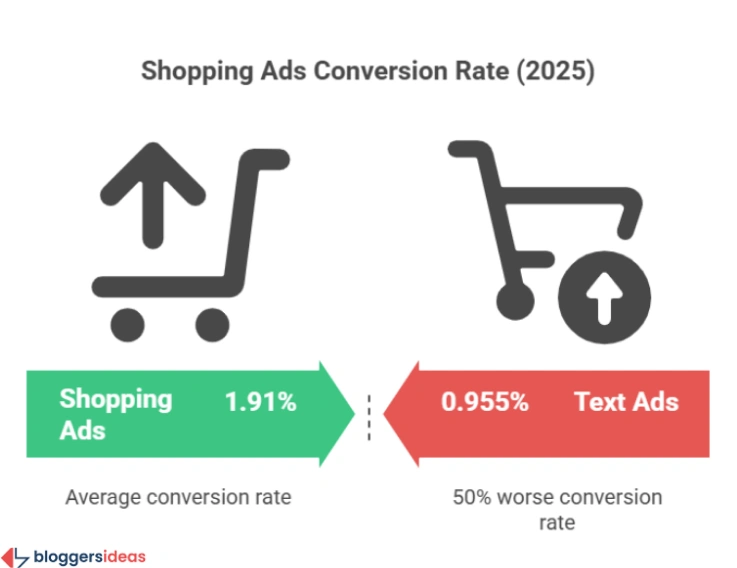
Conversion rates average 7.52% across search ads, up 6.84% YoY, with 65% of industries improving. Search Network: 6%; Display: 0-1%; Shopping: 1.91%. B2B median: 2.91%; B2C: 5.59%.
Dating & Personals leads at 9.64%, followed by Legal (6.98%) and Consumer Services (6.64%). Lowest: Advocacy (1.96%), Real Estate (2.47%).
| Industry | Average CVR 2025 |
| Auto Repair | 14.67% |
| Animals & Pets | 13.07% |
| Physicians | 11.62% |
| Education | 11.38% |
| … (lowest: Finance) | 2.55% |
Ads converters are 50% more likely to buy than organic visitors. 90% say ads influence decisions. You improve CVR by optimizing landing pages, tracking offline conversions, and using value-based bidding. 15 industries saw 40%+ gains, like Sports (42.43%).
Cost Per Click and Management Expenses
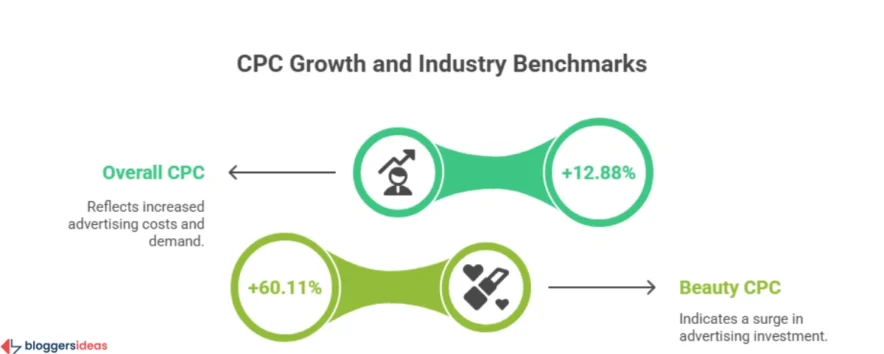
Average CPC: $4.22 overall, $5.26 in search ads (up 12.88% YoY). Search Network varies by industry:
| Industry | Search CPC | Display CPC |
| Legal | $6.75 | $0.72 |
| Consumer Services | $6.40 | $0.81 |
| … (lowest: E-commerce) | $1.16 | $0.45 |
87% of industries saw CPC increases, highest in Beauty (60.11%). Monthly ad spend: $9,000-$30,000; management: $1,000-$10,000 or $350-$5,000 (12-30%).
Agencies: 21.2% charge $1,001-$3,000. Tools: $15-$800. You lower CPC with high Quality Scores, smart bidding, and excluding low-intent terms.
Cost Per Lead and ROI Optimization
Average CPL: $70.11, up 5.13% YoY (milder than 25% prior). Lowest: Auto Repair ($28.50); highest: Legal ($131.63). 13 industries increased, but Career & Employment dropped 46.74%.
You reduce CPL by improving CVR (focus landing pages) and using first-party data. Track lead value—high CPL justifies if lifetime value exceeds.
| Industry | Average CPL 2025 |
| Auto Repair | $28.50 |
| Restaurants | $30.27 |
| Arts & Ent. | $30.27 |
| Legal | $131.63 |
| Furniture | $121.51 |
Shopping Ads Performance and Retail Impact
Shopping Ads convert at 1.91%, CTR 0.86%, CPC $0.66.
They claim 76.4% of US retail search spend and 1.2 billion monthly searches. You integrate product feeds, optimize titles/images for 85.3% click share.
Mobile and Emerging Trends in Google Ads 2026
Mobile effectiveness: 5x higher than desktop. 33% of spend goes to Google. Voice search rises with assistants; optimize long-tail.
AI integrates—voice-overs boost recall 25%, cut costs 50%. Phase-out of third-party cookies by Q3 2024 shifts to first-party data, GA4 audiences. 94% of SMBs increase marketing spend; 84% use/plan Google Ads.
Performance Max and Demand Gen lower CPC in visual industries like Real Estate ($2.53). You diversify: replicate on Microsoft Ads for cheaper clicks.
Quora and Reddit on Google Ads 2026
Reddit’s r/PPC warns of PMax black-box issues—users ask about auditing AI decisions; solution: hybrid campaigns with manual search for control.
Quora threads discuss post-cookie targeting—leverage Customer Match, enhanced conversions for 20-30% better ROAS. Emerging: multi-ad same-brand SERPs drive competition; counter with hyper-relevant ads.
Users query AI overbidding—set value-based smart bidding, cap at 15% ad spend. TikTok Shop integration queries rise—sync feeds for cross-platform. Privacy-focused: consent mode v2 mandatory; non-compliant lose 40% data.
You implement: test PMax with 20% budget, use SWOT audits quarterly, feed scored calls for optimization.
Strategies to Optimize Google Ads for Your Business
You structure accounts by goals—separate high-value keywords. Target demographics, in-market audiences. Craft compelling copy: questions lower opens, but assets raise CTR 20%.
Bid smart: Maximize Conversions for volume, Target ROAS for profit. Audit weekly: 30 minutes on keywords/bids. Complement with SEO—ads get 65% buying clicks. Track cross-channel: social drives searches.
| Optimization Tip | Expected Impact |
| Ad Assets | +20% CTR |
| Smart Bidding | -15% CPL |
| First-Party Data | +25% ROAS |
94% plan spend increases—act now for edge.
FAQs About Google Ads Statistics
1. What’s Google Ads’ market share and reach in 2025?
Google Ads dominates with 80.2% PPC share and 90% reach. Brands invest 65% of budgets in mobile ads for up to 200% ROI.
2. How do click-through rates vary by industry?
Average CTR is 6.66%, peaking at 13.1% in Arts & Entertainment. Use sitelinks, visuals, and AI copy to lift engagement by 20%.
3. What are the 2025 conversion rate benchmarks?
Average CVR hits 7.52%, with Auto Repair leading at 14.67%. Improve via optimized pages and value-based bidding.
4. How have CPC and CPL changed in 2025?
CPC averages $5.26 and CPL $70.11. Reduce costs by raising Quality Scores and using smart bidding and first-party data.
5. What key trends should businesses focus on?
Embrace AI for better recall, voice search, and GA4 data use. Adopting Performance Max boosts ROAS by up to 30%.
Also Read:
- Pinterest Statistics
- Android Usage Statistics
- Mobile Internet Traffic Statistics
- Voice Search Statistics
- Gmail Statistics
Conclusion: Leverage Google Ads Statistics 2026 for Measurable Success
These 93+ Google Ads statistics 2025 prove the platform’s unmatched power in driving traffic, conversions, and revenue.
You achieve 200% ROI by focusing on mobile, AI, and data-driven bids while monitoring CTR (6.66%), CPC ($5.26), CVR (7.52%), and CPL ($70.11).
Start with a $5,000 pilot, diversify networks, and audit regularly to scale sustainably in 2025’s evolving SERP.