Social networks are like big online playgrounds where people from all over the world come to chat, share pictures, and tell stories. Think of them as huge digital parties where everyone is invited!
Almost everyone, from young kids to grandparents, has joined in. These networks let us keep in touch with friends, learn new things, and even meet new people.
I’ve gathered some cool numbers to show you just how many people love using these online spaces and what they’re doing there. It’s pretty amazing to see how popular they’ve become!
| Statistic | Value |
|---|---|
| Total Global Social Media Users | 5.04 billion |
| Average Social Media Accounts per Millennial/Gen Z User | 8.5 |
| Global Daily Social Media Usage (Average) | 145 minutes |
| Percentage of Monthly Users on Popular Platforms Daily | 65.86% |
| Global Average Click-through Rate (CTR) for Social Media | 1.21% |
| Percentage of Businesses Using Social Media | 77% |
| Percentage of Users Following at Least One Brand | 90% |
| Percentage of Social Media Users Accessing via Mobile | 99% |
| Percentage of Global Internet Users on Social Media | 56.8% |
| Percentage of Engaged Monthly Users out of 4.8 billion | 93.33% |
| Percentage of Engaged Smartphone Users out of 5.27 billion | 85% |
| Percentage of Global Internet Users on Social Media (US) | 76% (female), 72% (male) |
| Social Media Usage for Work (Global) | 40% |
| Social Media Usage for Work (United States) | 27% |
| Social Media Usage for Work (India) | 47% |
| Social Media Usage for Work (Canada) | 31% |
| Social Media Usage for Work (Australia) | 30% |
So, how huge is social media & how has it changed in the last several years?
You’ll explore the current social network statistics by the figures and crucial demographics in this fantastic statistical overview. Here’s a quick rundown of what you’ll learn:
Statistics on Social Media

Sources: Pexels
- What percentage of the population uses social media?
- Rates of worldwide social media growth
- Penetration of social media by country
- The statistics on social media in the United States
- In the United States, the use of social media is increasing.
- The most widely used social media sites
- Time devoted to social media on average
- Devices Used for Social Media
Statistics on Social Media Use (Top Picks)
- The total number of social media users globally reached 5.04 billion, with 266 million new users in the last year.
- The typical social media user interacts with 6.6 different social media networks.
- Since 2015, the average annual growth rate for social media has been 12.5% each year. However, the growth is slowing, with figures for 2019-2020 showing a 9.2 percent growth rate.
- Asia (+16.98 percent), Africa (+13.92 percent), South America (+8.00 percent), North America (+6.96 percent), Europe (+4.32 percent), and Australasia (+4.9 percent) are the top five regions for social media development in 2019-2020.
- 60.99 percent of the world’s 7.87 billion individuals utilize social media, with 63 percent of qualified audiences aged 13 & up as active users.
- Although 93.33 percent of internet users utilize social media, a massive 85 percent of cell phone internet users use social media networks.
- Out of 4.48 billion social media users, only 1.32 percent access platforms exclusively via desktop, while 99 percent access websites and apps through their smartphone devices.
- Individuals spend an estimated 2 hrs 24 mins per day on media platforms worldwide; if someone started a social media account at the age of 16 and survived till 70, they would’ve spent 5.7 years of their lifetime on it.
- Facebook is the leading social network, with 2.9 billion active monthly users members, followed by YouTube (2.3 bn), WhatsApp (2 bn), Facebook Messenger (1.3 bn), and WeChat (1.2 bn).
- 72.3 percent of the entire population of the United States, or 240 million people, utilize social media.
- In the United States, 54 percent of social media members are women, while 46 percent are men, compared to a worldwide average of 45.6 percent for women and 54.4 percent for men.
- Approximately 62.3% of the world’s population uses social media, with an average daily usage of 2 hours and 23 minutes.
- The total number of social media users globally reached 5.04 billion, with 266 million new users in the last year.
- According to recent studies, 94.2% of internet users are active on social media platforms. This indicates a high level of penetration of the internet and social media in people’s lives.
- The social media app market was valued at $49.09 billion in 2022, with a predicted CAGR of 26.2% from 2023 to 2030.
- The most frequently used social media platform in the world is Facebook, with a whopping 2.9 million monthly active users globally.
What Percentage of The Population Uses Social Media?
The total number of social media users globally reached 5.04 billion, with 266 million new users in the last year.
Over 65.86 percent of monthly users on popular social media platforms like Facebook log in to use on a daily basis.

Sources: Pexels
Several social media networks measure growth in terms of monthly active users, or MAUs, rather than accounts since this information is more accurate in terms of determining real usage and territorial penetration.
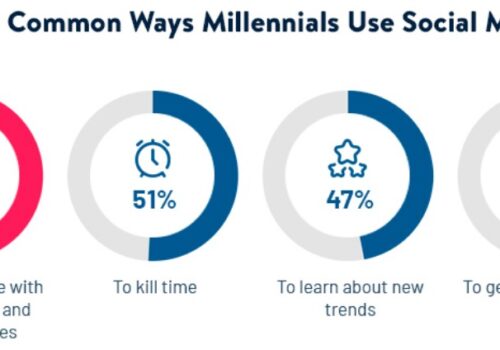
- On a daily basis, an average person spends around 145 minutes using social media.
- 66% of consumers prefer short-form videos, making them the most engaging type of content.
- It is observed that 99% of social media users access various platforms through their mobile devices.
- In 2023, Instagram was used by 74.70% of internet users in India, making it the most popular social network in the country.
- With 71.20% of internet users having profiles, Facebook is the second most popular social media platform in India.
What Is The Average Number of Social Media Accounts?
The average number of social media accounts used by millennial or Gen Z users worldwide is 8.5.
According to research on 46 nations with internet users aged between 16 and 64, Japan had the lowest overall number of social media accounts at 3.8, while India had the highest at 11.5 accounts per user.
BloggersIdeas Viewers Will be Interested in the Following Five Highlights:
- In India, there are 11.4 accounts per individual on average.
- In the United States, there are 7.1 accounts per individual on average.
- In the United Kingdom, there are 6.9 accounts per individual on average.
- In Canada, there are 6.8 accounts per individual on average.
- In Japan, there are 3.8 accounts per individual on average.
How Many Individuals Use Social Media for Work?
Social media is used for work by 40% of overall internet users worldwide. Only 27% of people in the United States actively make use of social media within their professions, compared to 65 percent in Indonesia and 13 percent in Israel.
Social Media Consumption For Work:
- In India, It is used for work by 47% of the population.
- In Canada, 31% of individuals use it for work.
- Australia is used by 30% of the population for work.
- In the United States, 27% of individuals use it for work.
- In the United Kingdom, 27% of individuals use it for work.
Social Media Consumption by Gender
Globally, there are slightly more men (54%) than women (46%) who use social media.
However, in the United States, women are the more active users with 76% of female internet users having social media accounts, compared to 72% of male internet users.
By area, which Gender is Active on Social Media the Most?
- In North America, 54 percent of users are female, while 46 percent are male.
- In South America, 52 percent of users are female, while 48 percent are male.
- In Western Europe, 50 percent of users are female, whereas 50 percent are male.
- In Southern Africa, 52 percent of users are female, while 48 percent are male.
- Female users account for 27% of users in Southern Asia, while male users account for 73%.
- Oceania has 53 percent female users, compared to 47 percent of male users.
Which Gender is Active on Social Media by Platform?
When looking at the data above, you can see that when looking at location, men and women use social media in different ways. When it comes to platform usage, the gender divide is perhaps the most noticeable.
When it comes to the top eight social media platforms in terms of active users by month, YouTube, Twitter, TikTok, and LinkedIn rank higher among men.
Female-oriented sites such as Facebook and Instagram, particularly Pinterest, which has a large female viewership, are more popular.
What is the Annual Growth Rate of Social Networking Sites?
In 2021, the world’s active social media users will number 4.48 billion, up by 13.13 percent versus 3.69 billion in the year 2020. There were just 2.07 billion users in 2015, indicating a 115.59 percent increase in users in just six years.
Statistics on social media growth over the last nine years:
- In 2015, there were 2.078 billion active users.
- In 2016, there were 2.307 billion active users, up 11% from the previous year.
- In 2017, there were 2.796 billion active users, up 21% from the previous year.
- In 2018, there were 3.196 billion active consumers, an increase of 9.0% from the previous year.
- In 2019, there were 3.484 billion active consumers, an increase of 9.2% from the previous year.
- In 2020, there were 3.960 billion active consumers, an increase of 13.7% from the previous year.
- In 2021, there were 4.480 billion active consumers, an increase of 13.13% from the previous year.
- In 2022, there were 4.623 billion active users, an increase of 3.19% from the previous year.
- In 2023, there were 4.950 billion active users, an increase of 7.07% from the previous year.
Rise of Social Media Consumers by Countries Who Are Topping the Charts
According to Keipo’s analysis, India saw the most substantial social media rise in 2019-2020, with 130 million new members – or 9.6 percent of the country’s total population – joining platforms.
China came in second with 15 million new users, followed by Indonesia (12 million), Brazil (11 million), Iran (9.4 million), and the United States in the sixth position having 6.9 million new subscribers.
Rise of Social Media Consumers by Location
From April 2019 and January 2020, the overall number of persons utilizing social media increased by 9.2 percent. When looking at the rate of new active users’ activation by area, Europe had the poorest activation rate at 4.9 percent.
Meanwhile, Asia saw the most significant increase in social media member base growth (16.98%), followed by Africa (13.92%).

Sources: Pexels
Regional Growth Dynamics of Social Media: 2024 Insights
- 74% in Eastern Asia
- 71% in North America
- 66% in Southern America
- 80-82% in both Northern and Western Europe.
- This falls to 32% in Southern Asia, 16% in Western Africa, and 10% in Middle Africa.
When did Social Media Begin?
Social media traces its origins back to the late 1990s, beginning with SixDegrees.com in 1997, which allowed users to create profiles and friend lists.
This era laid the groundwork for the social networking revolution. The early 2000s saw the emergence of platforms like Friendster, MySpace, and LinkedIn, each introducing new ways to connect online.
However, it was Facebook’s launch in 2004 that significantly propelled social media into mainstream culture, initially connecting university students before expanding globally.
The subsequent years welcomed Twitter, Instagram, and Snapchat, highlighting the shift towards mobile use and multimedia sharing.
Today, platforms like TikTok continue to redefine social engagement, underscoring social media’s dynamic evolution and its profound impact on global communication and culture.
Initial Years of Social Media
- Bolt, which was operational from 1996 to 2007, was the pioneer of social networking and video websites.
- 1997: Six Degrees, a website where users may publish personal details and connect with other users by establishing ‘friends,’ was launched.
- AOL purchased the Instant Messenger service from an Israeli business in 1997, and it was initially known as ICQ and launched in 1996.
- LiveJournal, the first prominent blogging site, was launched in 1999.
- Habbo, a game-based networking site, was created in 2000. In 2002, Friendster was founded, allowing users to create profiles, connect, and exchange material. In 2003, LinkedIn, the first business-oriented social networking site, was launched.
- Facebook, arguably the most successful platform of all time, debuted in 2004.
Wikipedia, GlobalWebIndex social media networks, Pew Research, and Kepio’s analysis were used as sources.
Penetration of social media by country
Which Country Has the World’s Highest Number of Active Social Media Users?
Active users versus total population = social media penetration.

Chinese social media users are also highly engaged, spending an average of over 2 hours and 12 minutes a day on social media platforms.
China has the largest number of social media users in the world, with over 1.03 billion active users as of 2024.
India has a rapidly growing social media landscape, with over 467 million active social media users.
By Total Population, Key Stats
- Regardless of age, 49 percent of the world’s population is engaged on social media.
- Social media is used by 63 percent of the world’s population aged 13 and up.
- The United States has 70% irrespective of age, with 83 percent for those aged 13 and up.
- The UK has a rate of 66 percent irrespective of age, with a rate of 79 percent for those aged 13 and up.
- Canada has a 67 percent rate for all ages, with 77 percent for those aged 13 and up.
- Australia has a 71 percent rate for all ages, with 85 percent for those aged 13 and up.
- India has 29 percent of the population, irrespective of age, and 38 percent for those aged 13 and up.
Which social networking sites are most popular?
| Social Media Platform | Monthly Active Users (in millions) |
|---|---|
| 3,030 | |
| YouTube | 2,491 |
| 2,000 | |
| 2,000 | |
| 1,327 | |
| TikTok | 1,218 |
| Facebook Messenger | 1,036 |
| Telegram | 800 |
| Snapchat | 750 |
| Douyin (TikTok in China) | 743 |
| Kuaishou | 673 |
| X (formerly Twitter) | 666 |
| Sina Weibo | 599 |
| 571 | |
| 465 |
Here’s the Breakdown of Internet Usage Across Different Devices:
- Mobile Phones: 55.89% of internet users access the internet via mobile phones.
- Desktop Computers: 41.36% of individuals use desktop computers to browse the internet.
- Tablets: 2.74% of internet users access the internet using tablets.
Regarding social media usage:
- 99% of social media users, which is approximately 4.43 billion people, use mobile devices.
- 78% of social media users, or 2.97 billion people, exclusively use mobile phones for social media.
- 1.32% of the population, around 50 million people, only use computers to connect to the internet for social media.
- Both smartphones and desktop computers are used by 20% of social media users, approximately 760 million people.
In terms of the number of devices:
- There are currently 3.50 billion smartphones worldwide, and 84.85% of smartphone owners use their phones to access social media.
- There are approximately 5.27 billion unique cellphone users worldwide.
FAQs
📱 How many people access social networks using mobile devices?
Approximately 55.89% of internet users access social networks via mobile phones, making mobile devices the dominant platform for social media access.
📈 How have social media usage patterns changed over the years?
Social media usage has evolved with the rise of mobile devices, video content, and new platforms. Users now spend more time on mobile devices and engage with various types of content.
🌐 What is the global market share of social media platforms by users?
Facebook, YouTube, WhatsApp, and Instagram consistently rank among the top social media platforms with the largest global user bases.
🌟 Are there any niche or specialized social networks gaining traction?
Yes, some specialized networks cater to specific interests or industries, such as Twitch for gaming, LinkedIn for professionals, and Strava for athletes.
Quick Links:
- Instagram Statistics
- Blogging Statistics
- Pinterest Statistics
- Fascinating Online Shopping Statistics
- E-Learning Stats and Trends
Conclusion: Social Network Usage Stats 2024
Social network usage is a big part of how people connect online. Facebook and YouTube have the most users globally, with billions of people.
Younger folks tend to use Instagram and Snapchat more. Messaging apps like WhatsApp and Facebook Messenger are widely used, too.
Social media is always changing, with new trends like live streaming and augmented reality. It’s crucial to stay updated on the latest stats as the internet world keeps evolving.
Now it’s your turn to respond: What else should be included in this roundup, in your opinion? Or perhaps you’d want to ask a question?
In any case, please join the conversation by leaving a comment below.
Source URLs: Backlinko, Statista, Brandwatch, Worldometers, Datareportal, Gwi, Wikipedia, Emarketer